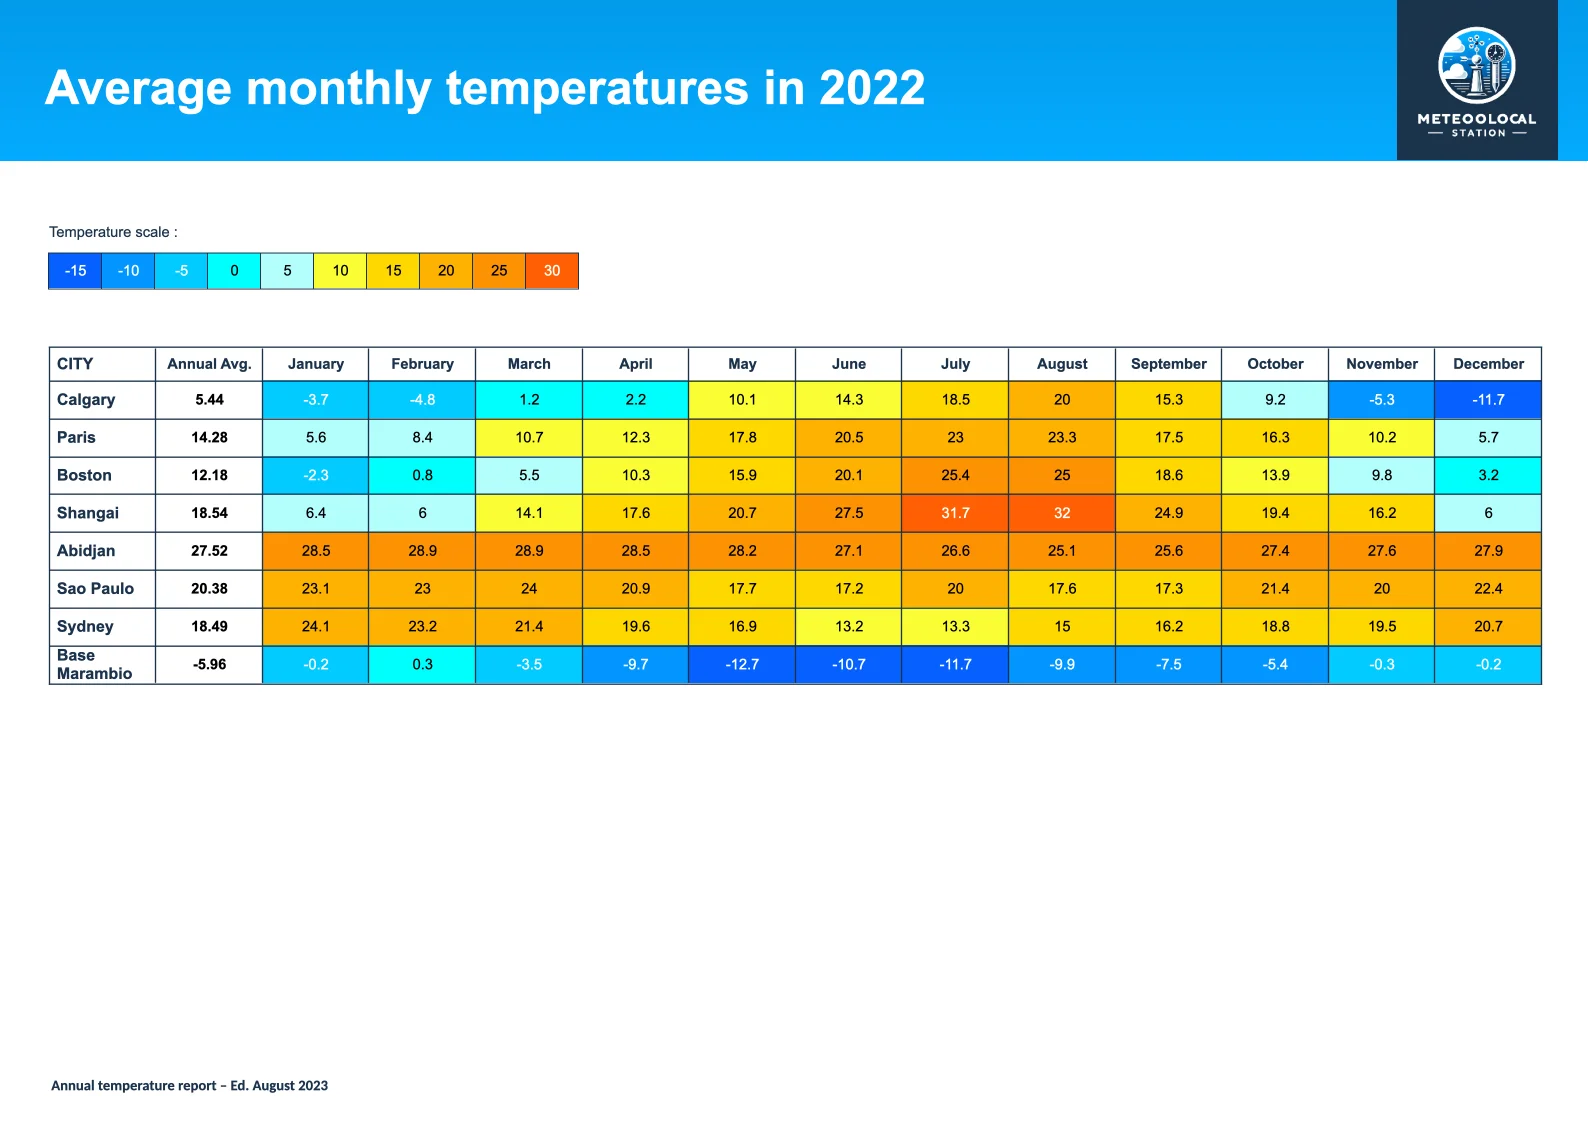
Sensor readings
Create stunning reports for your industrial temperature sensors
- Template type document docx simple
- Carbone min. v4.24.0+
- Features bidirectional-loop color aggregator
- Target datasheet audit monitoring industry tests reports
Overview
Learn how to generate professional temperature monitoring reports that include:
- Time-based sensor measurements using horizontal data loops
- Location-based sensor measurements using vertical data loops
- Dynamic cell coloring based on temperature values
Step-by-Step Guide
1. Define Temperature Scale and Colors
First, create a legend table that shows temperature ranges and their corresponding colors. This will serve as a visual guide for interpreting the data.
2. Structure Your Data Table
Create a table to display your temperature data:
a. Insert values using Carbone tags
b. Set up the vertical loop for different locations:
- Use tags like
{d.town[i].name}for current row - Use
{d.town[i+1]}for next row
c. Configure the horizontal loop for time-based data:
- Header row:
{d.town[0].data[i].month}and{d.town[0].data[i+1].month} - Data rows:
{d.town[i].data[i].month}and{d.town[i].data[i+1].month}
Note: While vertical loops need only one [i+1], horizontal loops require repeating [i+1] for each iteration.
3. Implement Dynamic Cell Coloring
Add color logic to your cells using Carbone's formatting features:
- Use these formatters:
- :ifGTE and :ifLT for value comparison
- :show() for color selection
- :color for applying background colors
Example of a basic color condition:
{d.town[i].data[i].temperature:ifGTE(-15):and:ifLT(-10):show(#0661FF):color(cell,background)}- Use the :or() formatter as many times as needed to define the color for each level of the previously defined scale:
{d.town[i].data[i].temperature
  :ifGTE(-15):and:ifLT(-10):show(#0661FF)
  :or(.temperature):ifGTE(-10):and:ifLT(-5):show(#0395FF)
  :or(.temperature):ifGTE(-5):and:ifLT(0):show(#03CBFF)
  :or(.temperature):ifGTE(0):and:ifLT(5):show(#00FEFD)
  :or(.temperature):ifGTE(5):and:ifLT(10):show(#B3FFFD)
  :or(.temperature):ifGTE(10):and:ifLT(15):show(#FBFD35)
  :or(.temperature):ifGTE(15):and:ifLT(20):show(#FFD800)
  :or(.temperature):ifGTE(20):and:ifLT(25):show(#FFB201)
  :or(.temperature):ifGTE(25):and:ifLT(30):show(#FC9203)
  :or(.temperature):ifGTE(30):show(#FF5F03)
  :color(cell,background)
}
4. Calculate Averages
Compute average temperatures using these formatters:
- Use
[]to select the entire data array - :aggAvg for average calculation
- :round() for decimal precision
Example:
{d.town[i].data[].temperature:aggAvg:round(2)}Related Examples
Trusted by 800+ paid customers in 40+ countries