Store Inventory
Present your inventory
- Template type document docx simple
- Carbone min. v4.24.0+
- Features bidirectional-loop placeholder
- Target product comparator insurance technology
Overview
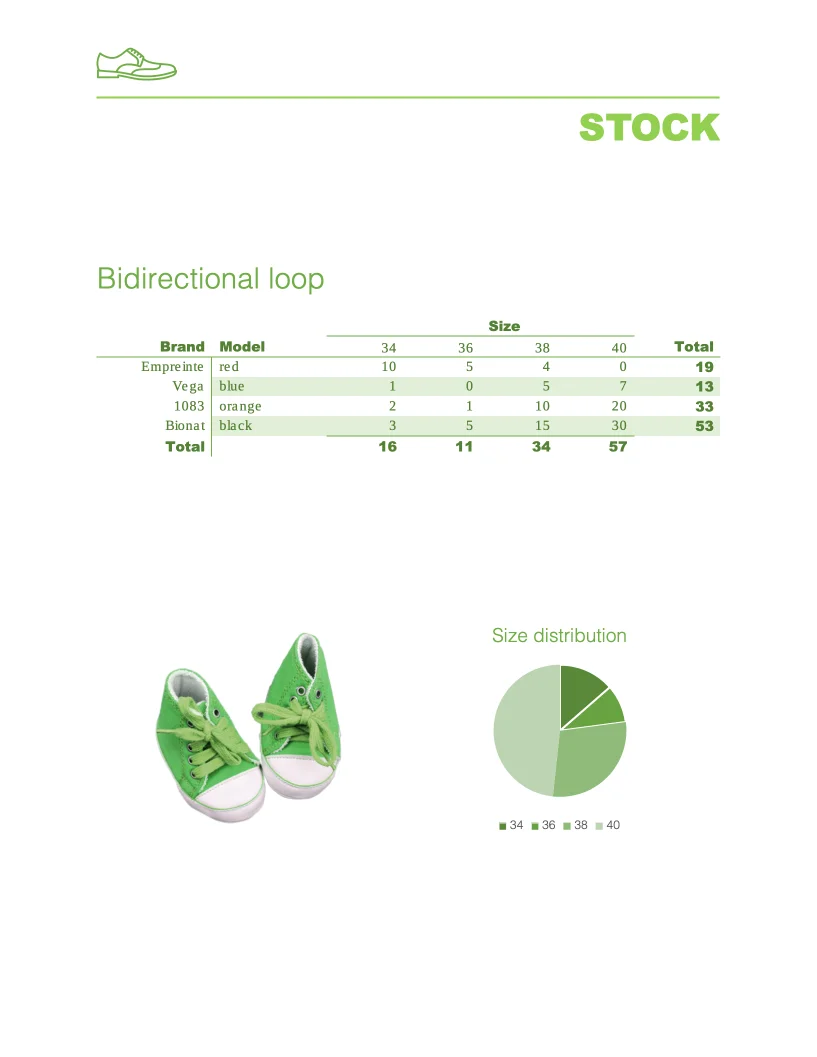
Create a professional store inventory report that includes:
- Structured table format for clear data presentation
- Horizontal loops to display different product sizes
- Automatic calculation of inventory totals
- Visual data representation through charts
Step-by-Step Guide
Follow these steps to create your inventory template using Carbone:
1. Create the Basic Table Structure
- Insert Carbone tags to read data from your array:
{d.products[i].brand}and{d.products[i].model} - Add the iterator
[i+1]in the row below for vertical iteration:{d.products[i+1]}
You only need one tag with [i+1] to enable iteration
2. Set Up Horizontal Repetition
- Add Carbone tags to read array data:
{d.allSize[size].size} - In the adjacent cell, define horizontal iteration:
{d.allSize[size+1].size} - Repeat this pattern for all data that needs horizontal display:
{d.products[i].size[size].qty}and{d.products[i].size[size+1].qty}
3. Add Calculations
- Use the :aggSum formatter to calculate total sums:
{d.products[i].size[].qty:aggSum}
4. Insert Charts
- Add a chart with your desired design
- Configure the chart data:
- Right-click the chart and select "Edit Data in Excel" (or wait for Excel to open automatically)
- Define your data series using Carbone tags and iteration:
|                        | Size                       |
|-----------------------------------------------------|
| {d.allSize[i].size}    | {d.allSize[i].totalQty}    |
| {d.allSize[i+1].size}  | {d.allSize[i+1].totalQty}  |
- The chart will update automatically during report generation
Your template is now ready to generate professional store inventory reports!
Related Examples
Trusted by 800+ paid customers in 40+ countries
Finance
Healthcare
Public
Retail
Industries
Energy
Software
Telecom