CSRD sustainability statement
ESRS E1 climate disclosures with GHG emissions, targets and energy mix
- Template
- HTML
- Export as
- PDF, HTML, PNG, WebP +7 more
- Carbone
- 5.18+
- HTML
- Loop
- Filter
- Aggregation
- Set
- Math
- Condition
- Number format
- Chart
- Header and footer
Generate CSRD sustainability statements from your ESG data
Sustainability and finance teams publish their sustainability statement once a year, in the management report, and redo it after every data correction, every board review and every remark of the assurance provider. ESG data platforms and sustainability reporting software collect the activity data of each site, compute the GHG inventory and hold the targets. Your application sends these figures to the Carbone API as JSON, and an HTML template returns the PDF of the statement, with every table and chart in line with the latest data.
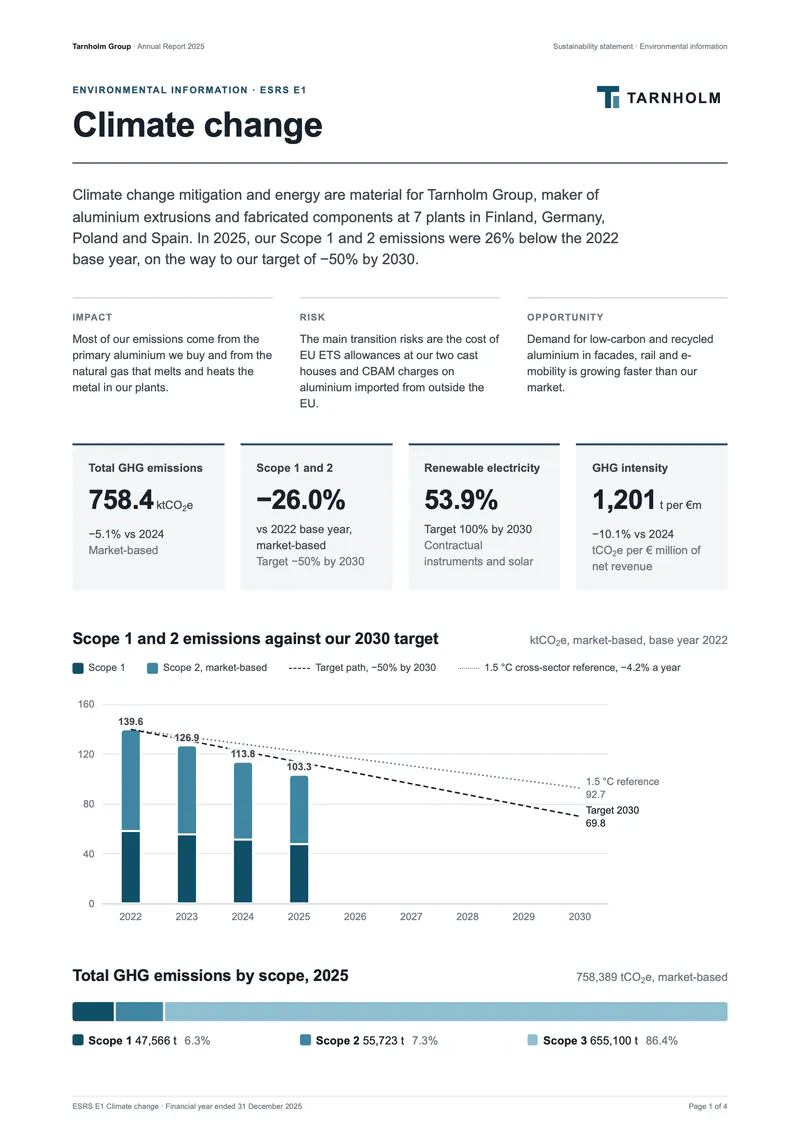
In this example, Tarnholm Group, a fictional maker of aluminium extrusions with 7 plants in Finland, Germany, Poland and Spain, publishes the climate section of its 2025 statement. The CSRD requires the statement, and the Omnibus I directive (EU) 2026/470, in force since 18 March 2026 and transposed by Member States by 19 March 2027, limits it to EU companies with more than 1,000 employees and a net turnover above €450 million. The section follows the structure of ESRS E1 Climate change in Delegated Regulation (EU) 2023/2772, as amended in 2025, the version for financial year 2025. The revised ESRS of Delegated Regulation (EU) 2026/1563 apply to financial years starting on or after 1 January 2027.
The statement keeps a place for the limited assurance report, which the assurance provider signs before publication. Digital tagging of sustainability statements in XBRL applies only once the Commission adopts the tagging rules, and none are adopted yet: ESMA plans its consultation for 2027 in its 2027 work programme. This example publishes the PDF, with no XBRL tagging.
In this example, you will:
- Compute the totals, the changes and the intensities from the raw figures of the data
- Repeat the Scope 3 categories with a filtered loop and list the excluded ones in a note
- Print the signs of the changes and the assurance placeholder with conditions
- Draw the emissions trajectory with ECharts and split the total by scope
- Paginate the PDF with repeated table headers, a running header and page numbers
The statement, page by page
| Page | ESRS E1 content | What Carbone does |
|---|---|---|
| Overview | Material impacts, risks and opportunities, key metrics, Scope 1 and 2 against the 2030 target and the 1.5 °C reference, total by scope | Computes the metrics once with :set, draws the chart, sizes the scope bar from the data |
| E1-6 GHG emissions | Scope 1 and its share under the EU ETS, location-based and market-based Scope 2, Scope 3 by category, totals, base year, change and targets | Repeats the categories with a filtered loop, sums them with :aggSum |
| E1-6 GHG intensity | Total GHG emissions per € million of net revenue, location-based and market-based, net revenue reconciled to the income statement | Divides the computed totals by the revenue of the data |
| E1-4 Targets | Gross absolute targets for 2030 and 2050, base year values, decarbonisation levers and their expected reductions | Repeats the targets and the levers, sums the levers |
| E1-5 Energy | Energy consumption and mix in the 11 lines of the ESRS table, shares of fossil, nuclear and renewable sources, energy intensity | Adds the lines and computes the shares |
| Basis and assurance | Basis of preparation, GHG Protocol methods, limited assurance report | Shows the placeholder until the report is signed |
The GHG figures follow the GHG Protocol Corporate Standard, the Scope 2 Guidance and the Scope 3 Standard, which ESRS E1 references. Every total, change and intensity is computed by the template from data.json, which holds only the raw figures, so the tables always tie out.
How to build a sustainability statement in HTML
1. Set Up the PDF Options, the Header and the Footer
Write the statement as an HTML page with its CSS in a <style> block, in a font installed everywhere, like Arial. Set the A4 page and its margins with the PDF options. The header and the footer repeat the report name, the section, the financial year and the page numbers on every page:
<carbone-pdf-options paper-size="A4" print-background="true" display-header-footer="true" margin-top="0.86" margin-bottom="0.62" margin-left="0.75" margin-right="0.75"/>

<carbone-pdf-header>
  <div><span>{d.company.name} · {d.report.title}</span><span>{d.report.section} · Environmental information</span></div>
</carbone-pdf-header>
<carbone-pdf-footer>
  <div><span>ESRS E1 Climate change · Financial year ended {d.report.periodEnd:formatD('D MMMM YYYY')}</span>
  <span>Page <span class="pageNumber"></span> of <span class="totalPages"></span></span></div>
</carbone-pdf-footer>
Each page of the statement is a <section> with break-before: page. In the CSS, thead { display: table-header-group; } repeats the column headers when a table continues on the next page, and tr { break-inside: avoid; } keeps each row whole.
2. Compute the Totals Once
The data holds the raw figures: Scope 1, the two Scope 2 methods, each Scope 3 category, the net revenue and the 11 energy lines. Tags in the <title> element compute the totals once with :set and print nothing. :aggSum sums the Scope 3 categories of the inventory only, with a filter:
<title>{d.company.name}, {d.report.section} {d.report.year}{d.ghg.scope3[inventory='included'].cur:aggSum:set(c.s3c)}{d.ghg.scope1.cur:add(d.ghg.scope2Market.cur):set(c.s12c)}{c.s12c:add(c.s3c):set(c.tmc)}</title>The tables then print {c.s3c:formatN(0)} and {c.tmc:formatN(0)}, and the GHG intensity divides the total by the net revenue in € million: {c.tmc:div(d.revenue.cur):formatN(1)}. :formatN sets the decimals of each unit, with thousands separators: tonnes of CO2e and MWh without decimals, intensities with one, and the units stand in the column headers.
3. Repeat the Scope 3 Categories
The data lists the 15 Scope 3 categories of the GHG Protocol, each included or excluded. A filtered loop prints a row for each category of the inventory, with the base year, the two years and the change:
<tr class="cat">
  <td>{d.ghg.scope3[i, inventory='included'].cat} {d.ghg.scope3[i, inventory='included'].name}</td>
  <td>{d.ghg.scope3[i, inventory='included'].base:formatN(0)}</td>
  <td>{d.ghg.scope3[i, inventory='included'].prev:formatN(0)}</td>
  <td>{d.ghg.scope3[i, inventory='included'].cur:formatN(0)}</td>
</tr>
<tr style="display:none;"><td>{d.ghg.scope3[i+1, inventory='included'].name}</td></tr>
The note under the table lists the excluded categories and their reason with the same loop on inventory='excluded', and prints the significant categories with {d.ghg.scope3[significant=true].cat:aggStr(', ')}.
4. Print the Changes With Their Sign
Each change compares the reporting year with the previous year. A formula computes the percentage, and a condition prints a minus or a plus sign before its absolute value:
{d.ghg.scope1.cur:sub(d.ghg.scope1.prev):ifLT(0):show('−'):elseShow('+')}{d.ghg.scope1.cur:sub(d.ghg.scope1.prev):div(d.ghg.scope1.prev):mul(100):abs:formatN(1)}%Inside the loop, .prev and .base read the fields of the current category, as in {d.ghg.scope3[i, inventory='included'].cur:sub(.prev):div(.prev):mul(100):abs:formatN(1)}%.
5. Draw the Trajectory and the Scope Breakdown
The data holds the ECharts configuration of two charts: Scope 1 and 2 by year against the target path and the 1.5 °C reference, and Scope 3 by category. Insert each chart in an <img> element with the :chart formatter. The bar of the total by scope is three <span> elements whose width comes from the data, with CSS values injected in flex-grow:
<img src="{d.charts.trajectory:chart}" width="650" height="244" alt="Scope 1 and 2 GHG emissions against the 2030 target">

<div class="segbar">
  <span style="flex-grow:{d.ghg.scope1.cur}; background:#0F5068;"></span>
  <span style="flex-grow:{d.ghg.scope2Market.cur}; background:#3F86A2;"></span>
  <span style="flex-grow:{c.s3c}; background:#8FBFD1;"></span>
</div>
6. Show the Assurance Placeholder
The data sends the status of the assurance engagement. Until the report is signed, a placeholder between showBegin and showEnd names the assurance provider and the expected date. Once the status is issued, a second block prints the conclusion instead:
{d.assurance.status:ifEQ('pending'):showBegin}
<div class="assurance">
  <h3>Independent limited assurance report</h3>
  <p>{d.assurance.provider}, the independent assurance provider, performs a limited assurance engagement on this sustainability statement under {d.assurance.standard}. Its report is inserted here once signed.</p>
  <span class="status">Expected {d.assurance.expected:formatD('D MMMM YYYY')}</span>
</div>
{d.assurance.status:showEnd}
7. Convert the HTML to PDF
When you generate the statement, select Chromium as the Document Converter, or set "converter": "C" and "convertTo": "pdf" in the API request. The PDF matches the layout displayed in Chrome.
Tip: the result is generated with the option lang en-gb, which sets the thousands separator and the decimal point of :formatN.
Related Examples
Check out these similar templates to learn more:
Trusted by 800+ paid customers in 40+ countries