HTML annual report
Key figures and quarterly results, with charts drawn by ECharts
- Template
- HTML
- Export as
- PDF, HTML, PNG, WebP +7 more
- Carbone
- 5.0+
Generate PDF reports from your SaaS data
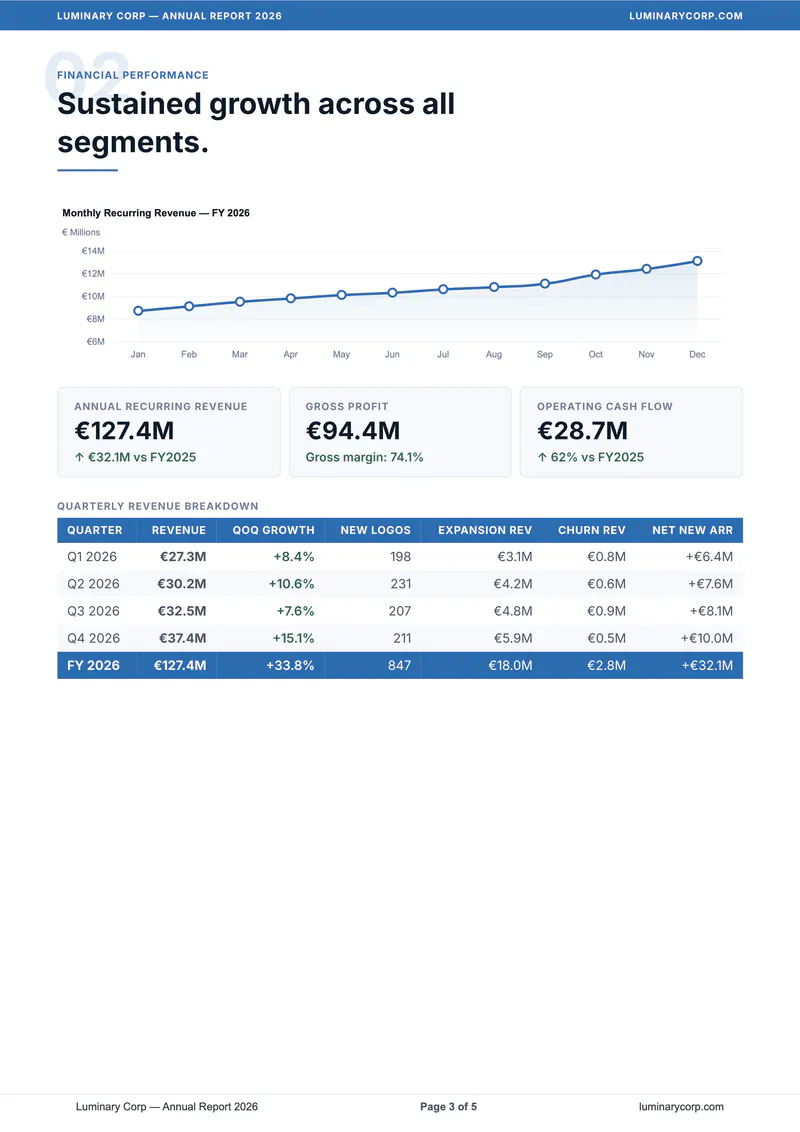
Finance, investor relations and SaaS analytics teams publish reports that mix key figures, tables and charts, and they often design them for the web first. Your application sends the figures to the Carbone API as JSON, and an HTML template styled with CSS becomes a multi-page PDF report, with charts drawn by ECharts and rendered by Chromium. Here, the annual report of a company presents its key figures, quarterly results, revenue breakdown and outlook, with cards, tables and charts filled from JSON data.
In this example, you will:
- Lay out an A4 report in HTML and CSS
- Repeat cards and table rows in loops
- Style the elements and insert charts from the data
- Convert the HTML template to PDF
How to build a multi-page PDF report in HTML
Follow these steps to generate an annual report from an HTML template with Carbone:
1. Set Up the Pages, PDF Options and Footer
In a code editor, create an HTML document with your CSS in a <style> block. Place each page in a <div> that starts with page-break-before: always. Then set the PDF options and the footer with Carbone elements:
<carbone-pdf-options paper-size="A4" print-background="true" display-header-footer="true" margin-top="0" margin-bottom="0.35" margin-left="0" margin-right="0"/>

<carbone-pdf-footer>
  <div>{d.company.name} | Annual Report {d.report.fiscalYear}</div>
  <div>Page <span class="pageNumber"></span> of <span class="totalPages"></span></div>
</carbone-pdf-footer>
2. Repeat the Cards and Table Rows
Display the data with Carbone tags, such as {d.company.name} or {d.report.fiscalYear}, and repeat the cards and table rows in loops. Everything between the first tag [i] and the tag [i+1] repeats for each item. Place [i+1] in a hidden element right after the repeated block:
<tr>
  <td>{d.financialPerformance.quarterlyRows[i].quarter}</td>
  <td>{d.financialPerformance.quarterlyRows[i].revenue}</td>
</tr>
<tr style="display:none;"><td>{d.financialPerformance.quarterlyRows[i+1].quarter}</td></tr>
The cover figures, key performance cards, milestones, segments, regions, guidance, risks and board members use the same pattern.
3. Style the Elements from the Data
Insert CSS values from the data in the style attributes, for example the background of a row or the color of a segment:
<td style="background:{d.revenueBreakdown.segments[i].rowBg};">{d.revenueBreakdown.segments[i].name}</td>To display a Fastest Growing badge on some regions only, surround it with showBegin and showEnd:
{d.revenueBreakdown.geographies[i].fastestGrowing:ifEQ(true):showBegin}<span>Fastest Growing</span>{d.revenueBreakdown.geographies[i].fastestGrowing:showEnd}4. Insert the Charts
The data contains an ECharts configuration for each chart: monthly recurring revenue, revenue by segment and net revenue retention. Insert each chart in an <img> tag with the :chart formatter:
<img src="{d.financialPerformance.mrrChart:chart}" style="width:100%;" alt="Monthly Recurring Revenue">5. Convert the HTML to PDF
When you generate the report, select Chromium as the Document Converter, or set "converter": "C" in the API request. The PDF then matches the layout displayed in the browser.
Save the HTML template, connect it to your JSON data, and let Carbone generate your annual report automatically.
Related Examples
Check out these similar templates to learn more:
Trusted by 800+ paid customers in 40+ countries