Monthly fund factsheet
NAV, performance, holdings and risks on a 2-page UCITS factsheet
- Template
- HTML
- Export as
- PDF, HTML, PNG, WebP +7 more
- Carbone
- 5.18+
Generate fund factsheets from your portfolio system
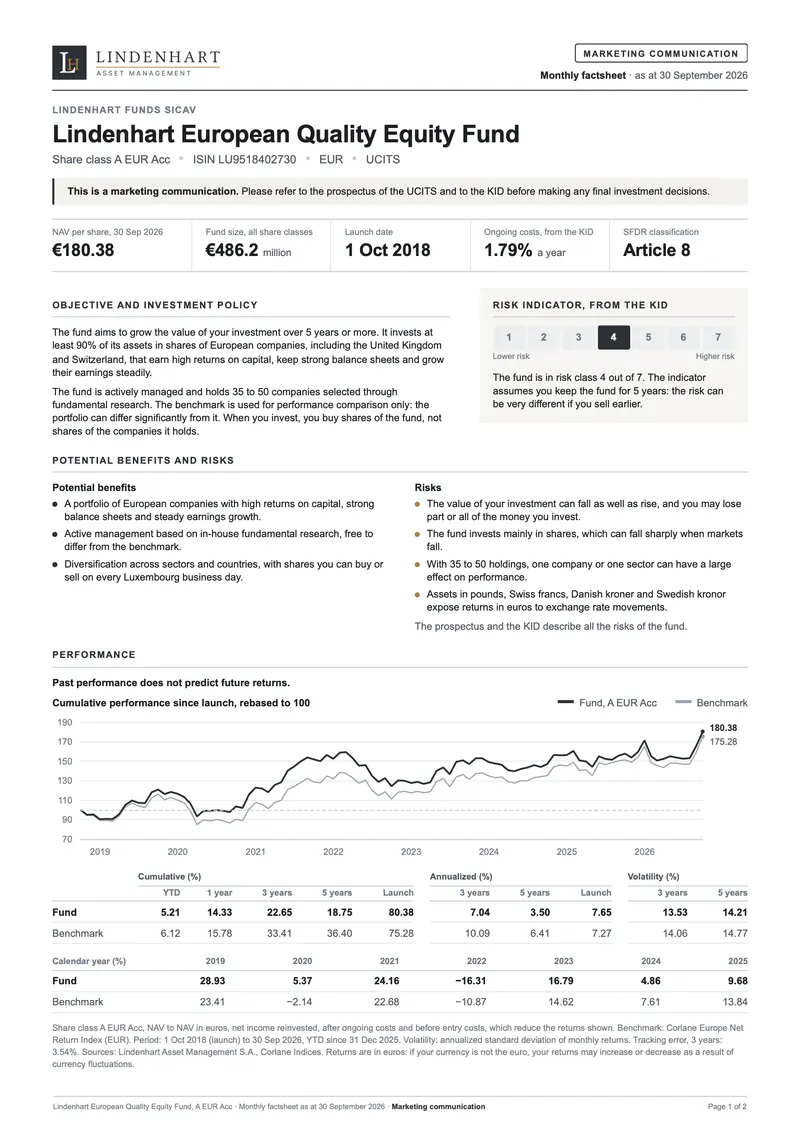
Asset managers publish a factsheet for every share class of every fund each month, a few days after the month ends, on their website, on fund platforms and for their distributors. The portfolio management system and the fund administrator hold the data: net asset values, benchmark levels, holdings, allocations and costs. A reporting job sends it to the Carbone API as JSON, once per share class and language, and gets back the PDF.
In this example, Lindenhart Asset Management, a fictional Luxembourg management company, publishes the factsheet of the A EUR Acc share class of its European equity fund, a UCITS, as at 30 September 2026. A factsheet is a marketing communication: the ESMA guidelines on marketing communications and Article 4 of Regulation (EU) 2019/1156 ask it to say so, to give the risks the same prominence as the benefits, and to tell investors where, how and in which language they can get the prospectus, the key information document (KID) and the summary of investor rights.
The past performance follows the same guidelines: the warning "Past performance does not predict future returns" before the figures, every complete calendar year since launch next to the cumulative chart, the benchmark of the KID, and a year-to-date return at the end of the most recent quarter. The risk indicator and the costs are those of the PRIIPs KID, and the sustainability section states the fund's classification under SFDR, here Article 8.
In this example, you will:
- Format the net asset value, the fund size and the costs with
:formatCand:formatN - Print the returns and weights of the data, stored as decimals, as percentages
- Repeat the return rows, the calendar years and the top 10 holdings in loops
- Highlight the risk indicator and keep the paragraph of the SFDR article with conditions
- Draw the performance and allocation charts with ECharts
- Lay out two A4 pages with a footer on each page
The factsheet, section by section
| Section | Content | What Carbone does |
|---|---|---|
| Header | "Marketing communication" label, fund, share class, ISIN, ESMA disclaimer | Formats the reporting date with :formatD |
| Key figures | NAV per share, fund size, launch date, ongoing costs, SFDR article | Formats the amounts with :formatC, adds up the ongoing costs once with :set |
| Objective and risk indicator | Investment policy, use of the benchmark, risk class of the KID from 1 to 7 | Highlights the risk class with an inline condition |
| Potential benefits and risks | Two lists side by side, in the same font size | Repeats the items in two loops |
| Performance | Warning, cumulative chart, cumulative and annualized returns, volatility, calendar years | Draws the chart with ECharts, repeats rows and columns in loops |
| Portfolio | Top 10 holdings, sector and country allocation, manager commentary | Totals the top 10 with :aggSum, draws two bar charts |
| Fund facts, costs, sustainability | Management company, depositary, costs of the KID, SFDR disclosure | Computes the cost example, keeps the paragraph of the SFDR article |
| Important information | Where to get the documents and in which languages, investor rights, end of marketing | Prints the links of the data |
How to build a fund factsheet in HTML
1. Set Up the Pages and the Footer
Write the factsheet as an HTML page with its CSS in a <style> block, in a font installed everywhere, like Arial. Set the A4 page and its margins with the PDF options, and repeat the fund, the date and the "Marketing communication" label on every page in the footer. The second page starts with a page break:
<carbone-pdf-options paper-size="A4" print-background="true" display-header-footer="true" margin-top="0.45" margin-bottom="0.6" margin-left="0.55" margin-right="0.55"/>

<carbone-pdf-header><div></div></carbone-pdf-header>
<carbone-pdf-footer>
  <div>{d.fund.name}, {d.shareClass.name} · Monthly factsheet as at {d.document.asOf:formatD('D MMMM YYYY')} · Marketing communication</div>
  <div>Page <span class="pageNumber"></span> of <span class="totalPages"></span></div>
</carbone-pdf-footer>
2. Format the Key Figures
:formatC prints the amounts in the currency of the report. The fund size is divided by one million first:
<p class="kpi-value">{d.shareClass.nav:formatC(2)}</p>
<p class="kpi-value">{d.fund.size:div(1000000):formatC(1)} <small>million</small></p>
The KID splits the ongoing costs into management and operating costs, and transaction costs. A tag in the <title> element adds them up once with :set, and prints nothing:
<title>{d.fund.name}{d.costs.managementAndOperating:add(d.costs.transaction):set(c.ongoing)}</title>The key figures print {c.ongoing:mul(100):formatN(2)}%, and the cost example prints the amount on €10,000 invested with {c.ongoing:mul(d.costs.example):formatC(0)}.
3. Print the Returns as Percentages
The portfolio system exports the returns and the weights as decimals, like 0.0521. :mul(100):formatN(2) prints 5.21, and a condition prints a true minus sign before the absolute value of a negative return. Each row of the returns table is one item of a loop:
<tr class="{d.performance.trailing[i].label:ifEQ('Fund'):show('is-fund'):elseShow('is-bench')}">
  <td>{d.performance.trailing[i].label}</td>
  <td>{d.performance.trailing[i].ytd:ifLT(0):show('−'):elseShow('')}{d.performance.trailing[i].ytd:abs:mul(100):formatN(2)}</td>
  <td>{d.performance.trailing[i].vol3:mul(100):formatN(2)}</td>
</tr>
<tr style="display:none;"><td>{d.performance.trailing[i+1].label}</td></tr>
The calendar years repeat as columns: the [i] and [i+1] tags sit in two cells of the same row, as in a horizontal loop:
<tr><th>Calendar year (%)</th><th>{d.performance.calendar[i].year}</th><th>{d.performance.calendar[i+1].year}</th></tr>
<tr><td>Fund</td><td>{d.performance.calendar[i].fund:ifLT(0):show('−'):elseShow('')}{d.performance.calendar[i].fund:abs:mul(100):formatN(2)}</td><td>{d.performance.calendar[i+1].fund}</td></tr>
Compute the statistics in your portfolio system and send them in the JSON. In this example, the cumulative and annualized returns, the volatility and the tracking error come from the same monthly NAV series that draws the chart.
4. Highlight the Risk Indicator and Keep the SFDR Paragraph
The risk scale has seven cells. An inline condition adds the on class to the cell of the risk class of the KID:
<span class="sri-cell {d.fund.sri:ifEQ(4):show('on'):elseShow('')}">4</span>The sustainability section holds one paragraph for each SFDR article: :drop(p) removes the two that do not match the article of the fund:
<p>The fund promotes environmental and social characteristics within the meaning of Article 8 of Regulation (EU) 2019/2088 (SFDR). It excludes {d.fund.sfdr.exclusions}, and invests at least {d.fund.sfdr.minSustainableShare:mul(100):formatN(0)}% of its assets in sustainable investments.{d.fund.sfdr.article:ifNE(8):drop(p)}</p>The costs table prints "None" for a cost of zero with the same pattern on two span elements.
5. Draw the Charts
The data holds an ECharts configuration for each chart. The performance chart draws the monthly series on a time axis: the fund line is the NAV per share itself, launched at €100, and the benchmark is rebased to 100 at launch. The allocation charts are horizontal bars, with a second category axis on the right that prints the weights of the fund and of the benchmark in two columns. Insert each chart in an <img> element with the :chart formatter:
<img src="{d.performance.chart:chart}" width="688" height="144" alt="Cumulative performance since launch">
<img src="{d.portfolio.sectorChart:chart}" width="329" height="164" alt="Sector allocation">
6. Total the Top 10 Holdings
The top 10 table repeats one row per holding, and its last row adds up the weights with :aggSum:
<tr class="total"><td colspan="2">Top 10 holdings</td><td>{d.portfolio.topHoldings[].weight:aggSum:mul(100):formatN(1)}</td></tr>7. Convert the HTML to PDF
When you generate the factsheet, select Chromium as the Document Converter, or set "converter": "C" and "convertTo": "pdf" in the API request. The PDF matches the layout displayed in Chrome.
Tip: the result is generated with the options lang en-gb, and currencySource and currencyTarget EUR. Send one request per language with a template in that language to publish the factsheet in each country of distribution.
Related Examples
Check out these similar templates to learn more:
Trusted by 800+ paid customers in 40+ countries