Executive KPI scorecard
A one-page balanced scorecard from your BI or ERP data

- Template
- SVG
- Export as
- PDF, PNG, SVG, WebP +24 more
- Carbone
- 5.18+
Generate KPI scorecards from your BI or ERP data
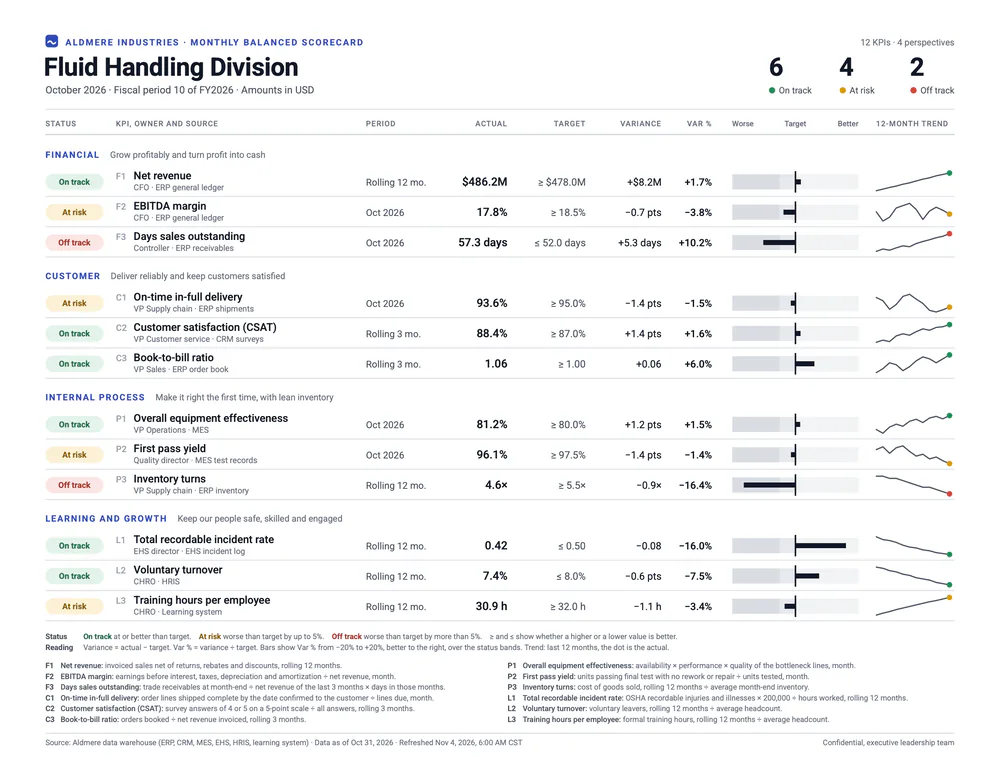
Finance, strategy and operations teams send their executives a one-page scorecard every month after the close, and every week for a plant or a region. BI platforms, ERP systems, data warehouses and balanced scorecard software hold the numbers. Your application sends them to the Carbone API as JSON, and an SVG template returns a US Letter PDF, ready to email or print. In this example, the Fluid Handling Division of Aldmere Industries reviews 12 KPIs for October 2026.
In this example, you will:
- Compute the status of each KPI from its actual, its target and your status rule
- Group the KPIs by perspective with nested loops
- Format each KPI in its own unit and number of decimals
- Draw a variance bar and a 12-month sparkline from the data
- Count the KPIs on track, at risk and off track
Scorecard layout
The KPIs follow the four perspectives of the balanced scorecard of Kaplan and Norton: financial, customer, internal process, learning and growth. Each KPI shows its owner, its source system and its period, and the footer defines it, so every reader computes it the same way.
| Area | Content | Rule |
|---|---|---|
| Header | Company, division, month, fiscal period and currency | The counts of KPIs on track, at risk and off track come from the KPIs |
| Status | On track, At risk or Off track | Computed from the variance and the status rule of the data. Each pill holds a word, so the status reads without color |
| KPI | Code, name, owner and source system | One line each, names up to 40 characters |
| Period | Month, rolling 3 months or rolling 12 months | Sent with each KPI |
| Actual and target | In the unit of the KPI | ≥ when a higher value is better, ≤ when a lower value is better |
| Variance and Var % | Actual minus target, and variance divided by target | The variance of a percentage is in points (pts) |
| Bar | Var % from −20% to +20%, better to the right | Gray bands mark the status bands, like the qualitative ranges of a bullet graph |
| Trend | The last 12 months, ending with a dot for the actual | Each sparkline uses the range of its own KPI |
| Notes | Status rule, reading guide and KPI definitions | The last line gives the source and the refresh time |
The safety KPI uses the incidence rate formula of the Bureau of Labor Statistics: recordable cases × 200,000 ÷ hours worked.
How to generate a KPI scorecard from JSON
Follow these steps to build the scorecard template with Carbone:
1. Design the scorecard on a US Letter artboard
- Set the page size on the
svgelement:width="11in" height="8.5in" viewBox="0 0 792 612". One unit is one point, and the PDF page takes this size. For A4, usewidth="297mm" height="210mm" viewBox="0 0 842 595". - Set the fonts once, on the
svgelement:font-family="Roboto, Helvetica Neue, Arial, sans-serif". Roboto is available on Carbone Cloud. On premise, install it on the server. - SVG text does not wrap: the KPI column fits names of up to 40 characters at 8.5 pt, and the footer fits definitions of about 110 characters.
- Write the tags in text elements, and in attributes for positions, sizes and colors. See SVG templates.
2. Compute the status of each KPI
The data holds the raw inputs of each KPI: actual, target, and polarity, 1 when a higher value is better and -1 when a lower value is better. A comment at the top of the template computes the status of every KPI with :set, before the layout:
{d.perspectives[].kpis[].actual:sub(.target):div(.target):mul(.polarity):set(.score)}
{d.perspectives[].kpis[].score:ifGTE(0):show('G'):ifGTE(d.statusRule.atRiskFloor):show('A'):elseShow('R'):set(.status)}scoreis the variance divided by the target, positive when the KPI does better than its target: Days sales outstanding at 57.3 days for a target of 52.0 scores -0.102.- The switch case gives G from 0, A down to
atRiskFloor(-0.05 in the data), and R below. Change the rule in the data: the statuses, the gray bands and the note follow. The note prints it with{d.statusRule.atRiskFloor:abs:mul(100):formatN(0)}%. - The pill takes its colors from the status:
fill="{d.perspectives[i].kpis[i].status:ifEQ('G'):show('#E3F3EA'):ifEQ('A'):show('#FCF1D6'):elseShow('#FBE6E4')}". - A filter counts each status for the header:
{d.perspectives[].kpis[status='G'].code:aggCount}.
3. Group the KPIs by perspective
The data lists the perspectives, each with its KPIs. Two nested loops repeat the group of a perspective and, inside it, the group of a KPI:
<g id="perspective" transform="translate(0 {d.perspectives[i].before:mul(24):add(.i * 24 + 108)})">
<g id="kpi" transform="translate(0 {d.perspectives[i].kpis[i].code:print(..i):mul(24):add(24)})">- Each KPI row is 24 points high, under a perspective header of 24 points.
..iis the number of the KPI in its perspective, and.ithe number of the perspective. See the loop index. beforecounts the KPIs of the previous perspectives, so a perspective can hold any number of KPIs. The comment computes it:
{d.perspectives[].kpis[].code:aggCount(.i):set(..count)}
{d.perspectives[].count:cumSum:sub(.count):set(.before)}- A group with
{d.perspectives[i].kpis[i+1].code}closes the loop of the KPIs, and a group with{d.perspectives[i+1].name}the loop of the perspectives. - The footer repeats the KPIs a second time for their definitions, in two columns of six: :floor and :mod turn the number of the KPI into a column and a line.
4. Format each KPI in its own unit
Each KPI brings its prefix, its unit and its number of decimals:
{d.perspectives[i].kpis[i].prefix}{d.perspectives[i].kpis[i].actual:formatN(.decimals)}{d.perspectives[i].kpis[i].unit}- With
"lang": "en-us", net revenue prints $486.2M and days sales outstanding 57.3 days. :formatN reads the number of decimals in.decimals. - The target shows which way is better:
{d.perspectives[i].kpis[i].polarity:ifEQ(1):show('≥'):elseShow('≤')}. - The variance prints its sign, with a true minus sign, before its absolute value
:abs:formatN(.decimals):{d.perspectives[i].kpis[i].actual:sub(.target):ifGT(0):show('+'):ifLT(0):show('−'):elseShow('')}. The variance of a percentage is in points:"deltaUnit": " pts". - Var % divides the variance by the target:
{d.perspectives[i].kpis[i].actual:sub(.target):div(.target):abs:mul(100):formatN(1)}%.
5. Draw the variance bars
The bar is a thick line that starts at the target, at x = 630, with 250 points for a variance of 100%: a variance of 20% fills the 50 points on each side.
x2="{d.perspectives[i].kpis[i].score:ifGT(0.2):show(0.2):ifLT(-0.2):show(-0.2):mul(250):add(630)}"- The score is positive when the KPI does better than its target, so the bar grows to the right for a better KPI, whether a higher or a lower value is better.
- The two conditions stop the bar at the edges of the column, and Var % prints the exact value.
- Behind the bar, three gray bands mark the status bands, placed from the status rule:
x="{d.statusRule.atRiskFloor:mul(250):add(630)}". - Keep the computed coordinates as raw numbers:
:formatNfollows the language of the report and can print a comma.
6. Draw the sparklines
The comment computes the range and the number of steps of each trend, with aggregators grouped by perspective and KPI:
{d.perspectives[].kpis[].trend[].value:aggMin(.i, ..i):set(..low)}
{d.perspectives[].kpis[].trend[].value:aggMax(.i, ..i):set(..high)}
{d.perspectives[].kpis[].high:sub(.low):ifEQ(0):show(1):set(.span)}
{d.perspectives[].kpis[].trend[].value:aggCount(.i, ..i):sub(1):set(..steps)}
A loop inside the points attribute of a polyline writes one x,y pair for each month:
<polyline points="{d.perspectives[i].kpis[i].trend[i].value:print(...i):mul(58):div(..steps):add(694)},{d.perspectives[i].kpis[i].trend[i].value:sub(..low):div(..span):mul(-14):add(19)} {d.perspectives[i].kpis[i].trend[i+1].value}"/>- Carbone repeats the text between the
[i]tags and the[i+1]tag. x spreads the months over 58 points, and y places each value between the low and the high of its KPI, over 14 points. ...iis the number of the month, and..lowreadslowin the KPI.- The dot is the actual, in the color of the status:
cy="{d.perspectives[i].kpis[i].actual:sub(.low):div(.span):mul(-14):add(19)}". Send the actual as the last value of the trend. - For a flat trend,
spanis 1, so the line stays in its row.
7. Generate the PDF
Send the data with these options:
{
  "data": { ... },
  "convertTo": "pdf",
  "converter": "C",
  "lang": "en-us",
  "timezone": "America/Chicago"
}
"converter": "C"draws the SVG with Chrome. The PDF has one US Letter page, with vector shapes and selectable text, and prints at 100%.timezoneprints the refresh time in the time zone of the readers:{d.refreshedAt:formatD('MMM D, YYYY, h:mm A z')}prints Nov 4, 2026, 6:00 AM CST.- To post the scorecard in a chat or on an intranet page, ask for a PNG:
"convertTo": { "formatName": "png", "formatOptions": { "Scale": 2 } }. See Convert SVG to PNG or PDF. - Call the API after the monthly close, or every Monday for an operations scorecard, with one request for each business unit or site.
SVG templates require Carbone v5. The conversion of an SVG to PDF with Chrome requires Carbone v5.17.0 or later.
Related Examples
Trusted by 800+ paid customers in 40+ countries