Quarterly board pack
Financials, KPIs, risks and resolutions from your ERP and EPM
- Template
- PPTX
- Export as
- PDF, PPTX, ODP, PNG, SVG +29 more
- Carbone
- 5.18+
Generate board packs from your ERP and EPM data
Before each board meeting, the office of the CFO and the company secretary assemble the board pack: the agenda, the CEO's highlights, the financial performance against budget and prior year, the KPIs, the principal risks, the strategic initiatives and the resolutions to approve. Directors receive it about a week ahead, often through a board portal. The UK Corporate Governance Code asks the chair to make sure that directors receive accurate, timely and clear information, and every quarter the same deck is rebuilt by hand from the same systems.
Board reporting follows a fixed structure, so it automates well. The actuals come from the general ledger of the ERP, the budget, the commentary and the KPIs from the EPM, the risks from the risk register and the initiatives from the portfolio tool. Your reporting job sends them to the Carbone API as JSON and gets back the PowerPoint deck, with native tables and charts, ready for a last review by the CFO before the pack goes out. Add "convertTo": "pdf" to the request to get the PDF for the board portal.
In this example, Elvaren Technologies, a fictional maker of industrial automation systems and software, prepares its Q3 2026 board pack for the meeting of November 5, 2026, in USD millions.
In this example, you will:
- Repeat table rows for the agenda, the risk register, the initiatives and the resolutions
- Compute the variances against budget and prior year in the template, with negative amounts in parentheses
- Fill native PowerPoint charts from the data
- Place each risk on a likelihood and impact heat map with
:transform - Color the RAG statuses and the unfavorable variances with
:color
What the board pack contains
The eleven slides follow the order that boards expect, with one message per slide in an action title. The tables, the charts and the titles read the same data, so the totals tie out from one slide to the next.
| Slide | Content | What Carbone does |
|---|---|---|
| 1 Cover | Company, meeting date and place, circulation date, period, sources | Formats the dates |
| 2 Agenda | Time, item, presenter, purpose (for decision, discussion or noting), paper | One row per item, decisions in navy |
| 3 CEO highlights | Performance, strategy, watch items, outlook | One bullet per item |
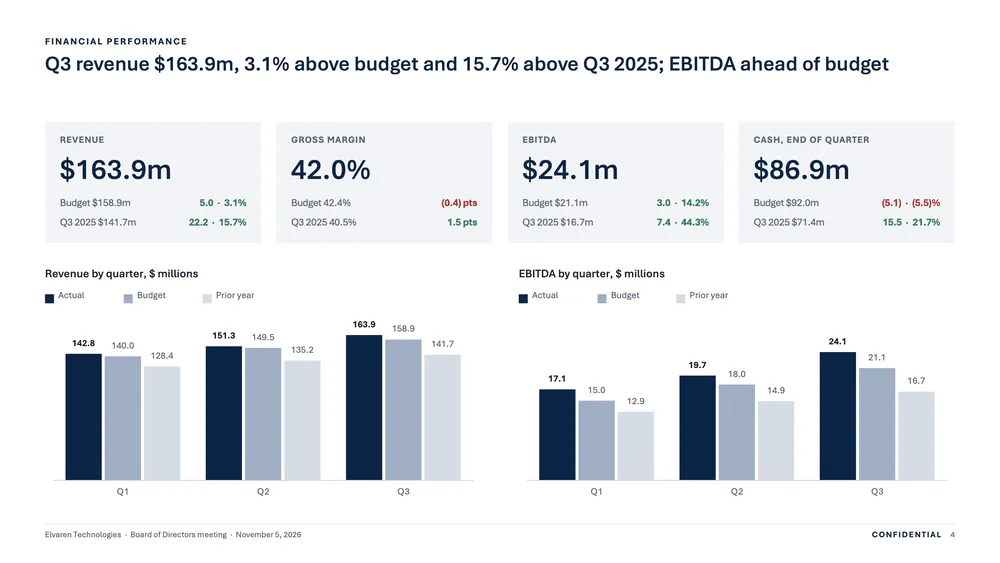
| 4 Financial performance | Revenue, gross margin, EBITDA and cash against budget and prior year | Computes the variances, fills two column charts |
| 5 KPI dashboard | Eight KPIs with target, prior quarter and status | Places one card per KPI, colors the status |
| 6 Profit and loss | Quarter and year to date: actual, budget, prior year, favorable/(unfavorable) | Computes the variances and the total operating expenses |
| 7 Cash flow and liquidity | Free cash flow, cash bridge, liquidity, covenants | Computes net debt, leverage and interest cover, fills a stacked chart |
| 8 Principal risks | Heat map and register: owner, likelihood, impact, score, trend, appetite | Moves each risk to its cell, colors the score |
| 9 Strategic initiatives | Sponsor, milestone, budget, spend, RAG status, commentary | One row per initiative, colors the status |
| 10 Decisions requested | Exact wording of each resolution, amount, recommending committee | One row per resolution, hides an empty amount |
| 11 Appendix | Revenue by segment, basis of preparation, definitions | Sums the segments |
Every slide after the cover shows "Confidential" and its page number in the footer.
How to automate a board pack in PowerPoint
1. Write the action titles and the footer
Each title is a single tag, like {d.titles.performance}: the CFO writes the message of each slide in the commentary of the EPM, and it arrives with the numbers. The footer sits on the slide layout, so it repeats on every content slide: {d.company.shortName} · {d.meeting.title} · {d.meeting.date:formatD(LL)}, then "Confidential" and the slide number field of PowerPoint. This example uses "lang": "en-us", so :formatD(LL) prints November 5, 2026.
2. Repeat the rows of the tables
The agenda, the risk register, the initiatives and the resolutions are PowerPoint tables with a loop: the first row holds the [i] tags, like {d.agenda[i].time} and {d.agenda[i].item}, and the next row holds {d.agenda[i+1].time} to end the loop. The JSON data:
{
  "agenda": [
    { "time": "9:05 a.m.", "item": "Minutes of July 30, 2026 and matters arising", "presenter": "Company Secretary", "purpose": "For decision", "ref": "Paper 1" }
  ],
  "risks": [
    { "id": "R1", "name": "Controller component supply", "owner": "COO", "likelihood": 4, "impact": 4, "trend": "stable", "appetite": "Outside" }
  ],
  "resolutions": [
    { "number": 1, "title": "Capital expenditure for Monterrey assembly Line 2", "amount": 18.5,
      "resolution": "RESOLVED, that the Board approves capital expenditure of up to $18.5 million for the second assembly line of the Monterrey plant, as set out in paper 6.",
      "recommendedBy": "Finance Committee", "paper": "Paper 6" }
  ]
}
In the register, {d.risks[i].likelihood:mul(.impact)} computes the score of each risk. In the resolutions, the amount cell has two paragraphs: ${d.resolutions[i].amount:formatN(1)}m{d.resolutions[i].amount:ifEM:drop(p)} and Not applicable{d.resolutions[i].amount:ifNEM:drop(p)}. The smart condition keeps one of them: the risk appetite statement has no amount.
3. Compute the variances and the totals
The profit and loss holds the figures of the ERP and the EPM, with costs as negative amounts:
"pl": {
  "revenue": {
    "qtr": { "actual": 163.9, "budget": 158.9, "prior": 141.7 },
    "ytd": { "actual": 458.0, "budget": 448.4, "prior": 405.3 }
  },
  "costOfSales": {
    "qtr": { "actual": -95.1, "budget": -91.6, "prior": -84.3 },
    "ytd": { "actual": -267.0, "budget": -259.5, "prior": -242.1 }
  },
  "opex": [
    { "name": "Sales and marketing", "qtr": { "actual": -18.6, "budget": -19.4, "prior": -16.9 }, "ytd": { "actual": -53.7, "budget": -56.1, "prior": -49.0 } }
  ]
}
{d.pl.revenue.qtr.actual:formatN(1, acc)}prints 163.9, and theaccoption of :formatN prints the costs in parentheses: (95.1).{d.pl.revenue.qtr.actual:sub(.budget):formatN(1, acc)}computes the variance against budget..budgetis the attribute next toactual. Because costs are negative, actual minus budget is favorable when it is positive, for revenue and for costs alike.- The operating expenses are a loop inside the table, and the total row sums them with an aggregator:
{d.pl.opex[]:print(.qtr.actual):aggSum:formatN(1, acc)}.:printreads a value inside a sub-object of each item. Its variance is{d.pl.opex[]:print(.qtr.actual):sub(.qtr.budget):aggSum:formatN(1, acc)}. - On the cash slide, the covenant figures are computed from the debt:
{d.liquidity.termLoan:add(.rcfDrawn):sub(.cash):div(.ltmEbitda):formatN(2)}xprints the net leverage, 1.47x.
4. Fill the native charts
Insert a chart in PowerPoint (Insert > Chart > Clustered Column), open its data sheet (right-click > Edit Data) and write the loop in the sheet: {d.trend[i].label}, {d.trend[i].revenue.actual}, {d.trend[i].revenue.budget} and {d.trend[i].revenue.prior} on row 2, the same tags with [i+1] on row 3. Carbone draws one group of columns per quarter, and the chart keeps the colors and the data labels of the template. The liquidity chart is a stacked column chart on d.liquidity.quarters. Learn more about charts in PPTX templates.
5. Place the risks on the heat map
The heat map is 25 rectangles, and the template has one risk marker in the cell of likelihood 1 and impact 1. Its alt text (right-click > View Alt Text) moves it to the cell of each risk:
{d.risks[i].likelihood:sub(1):mul(60):transform(x, pt)} {d.risks[i].impact:sub(1):mul(-50):transform(y, pt)}A cell is 60 pt wide and 50 pt high, and the negative distance moves the marker up. The text box {d.risks[i+1].id} ends the loop and sits in front of the marker in the layer order. The KPI cards use the same technique with :print(.i), four cards per row, like the card grid. Learn more about :transform.
6. Color the statuses and the variances
:color applies a color chosen by a condition:
- The status of an initiative:
{d.initiatives[i].rag:ifEQ(green):show(2F7D5B):ifEQ(amber):show(B7791F):elseShow(B3261E):color(cell, text)}, next to the label{d.initiatives[i].rag:ifEQ(green):show('On track'):ifEQ(amber):show('At risk'):elseShow('Off track')}. - The dot of a KPI card: the same condition ends with
:color(shape, background)in the alt text of the dot. - An unfavorable variance of the profit and loss:
{d.pl.revenue.qtr.actual:sub(.budget):ifLT(0):show(B3261E):elseShow(1B2433):color(cell, text)}. - The score of a risk:
{d.risks[i].likelihood:mul(.impact):ifGTE(15):show(B3261E):ifGTE(5):show(B7791F):elseShow(2F7D5B):color(cell, text)}, in the colors of the heat map.
These tags print nothing, so they sit in a cell or a text box that already holds the value.
Related Examples
Trusted by 800+ paid customers in 40+ countries