Product roadmap slide
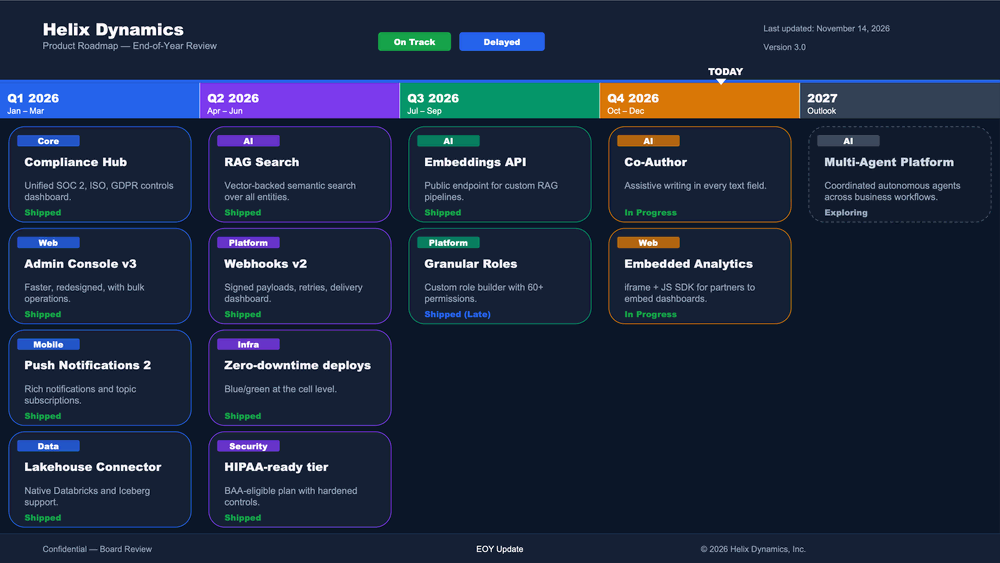
Your quarterly plan with status colors and a Today marker
- Template
- PPTX
- Export as
- PDF, PPTX, ODP, PNG, SVG +29 more
- Carbone
- 5.0+
Generate roadmap slides from your planning data
Product teams show their quarterly roadmap in board reviews, customer presentations and internal updates, and rebuild the slide each time the plan moves. Your planning tool or product database sends the plan to the Carbone API as JSON, and this PPTX template fills the feature cards of each quarter, hides the empty ones, colors each status according to the legend and places a Today marker on the timeline. An n8n workflow can rebuild the slide on a schedule.
In this example, you will:
- Display features in columns, one column per quarter
- Hide empty cards and labels automatically
- Color the statuses based on a value from your data
- Move a Today marker dynamically
Note: This template works on a single slide with a fixed layout: 5 columns (Q1, Q2, Q3, Q4 and Next year) with up to 4 cards per column.
How to automate a roadmap slide in PowerPoint
Follow these steps to create your product roadmap slide with Carbone:
1. Lay Out the Header and the Quarter Columns
- Insert text boxes for the header and the footer, and display the data with Carbone tags.
Examples:
{d.company},Last updated: {d.lastUpdated}or{d.footer.left} - Draw one rectangle per period (here 192 pt wide) and add the period label and date range at the top.
Examples:{d.q1.label}and{d.q1.range}, up to{d.next.label}and{d.next.range}
2. Design the Feature Cards
- Build each card with a rounded rectangle for the background, a small rounded rectangle for the category badge, and text boxes for the name, description and status.
Examples:{d.q1.c1.tag},{d.q1.c1.name},{d.q1.c1.desc}and{d.q1.c1.status} - Duplicate the first card to fill the grid (4 cards per column), then update the tags in each copy.
Examples:{d.q1.c2.name}for the second card of Q1,{d.q2.c1.name}for the first card of Q2
3. Hide Empty Cards
- Right-click each shape of the card, select View Alt Text, and add:
{d.q1.c1.name:ifEM():drop(shape)}- :ifEM checks if the feature name is empty.
- :drop(shape) removes the shape when the condition is true.
- Add this tag to every shape of the card (background, badge, name, description and status), because
:drop(shape)only removes the shape that contains it.
Tip: The legend badges in the header work the same way: {d.status1.label} displays the label, and {d.status1.label:ifEM():drop(shape)} in the Alt Text hides the badge when the label is empty (here status3).
4. Color the Statuses
- After the status tag, add a condition on the
statevalue of the card and apply the color with :color:{d.q1.c1.status}{d.q1.c1.state:ifEQ(onTrack):show(16A34A):ifEQ(delayed):show(2563EB):elseShow(94A3B8):color(shape, text)} - The status is green when on track, blue when delayed, and grey otherwise, matching the legend colors.
Tip: In PPTX, :color applies to a shape, a table row or a cell.
5. Add a Dynamic "Today" Marker
- Insert a text box with the word TODAY and a small triangle under it, at the start of the timeline (left edge of the Q1 column).
- In the Alt Text of both shapes, add
{d.todayOffsetPt:transform(x, pt)}. :transform(x, pt) moves the shape on the x-axis by the value from your data, in points.
Tip: Your application calculates the offset from the start of the year. One quarter column is 192 pt wide, so one month is about 64 pt: an offset of 672 (10.5 × 64) places the marker in mid-November.
Save the PPTX template, connect it to your JSON data, and let Carbone generate your product roadmap slide automatically.
Related Examples
Check out these similar templates to learn more:
Trusted by 800+ paid customers in 40+ countries