Budget vs actual report
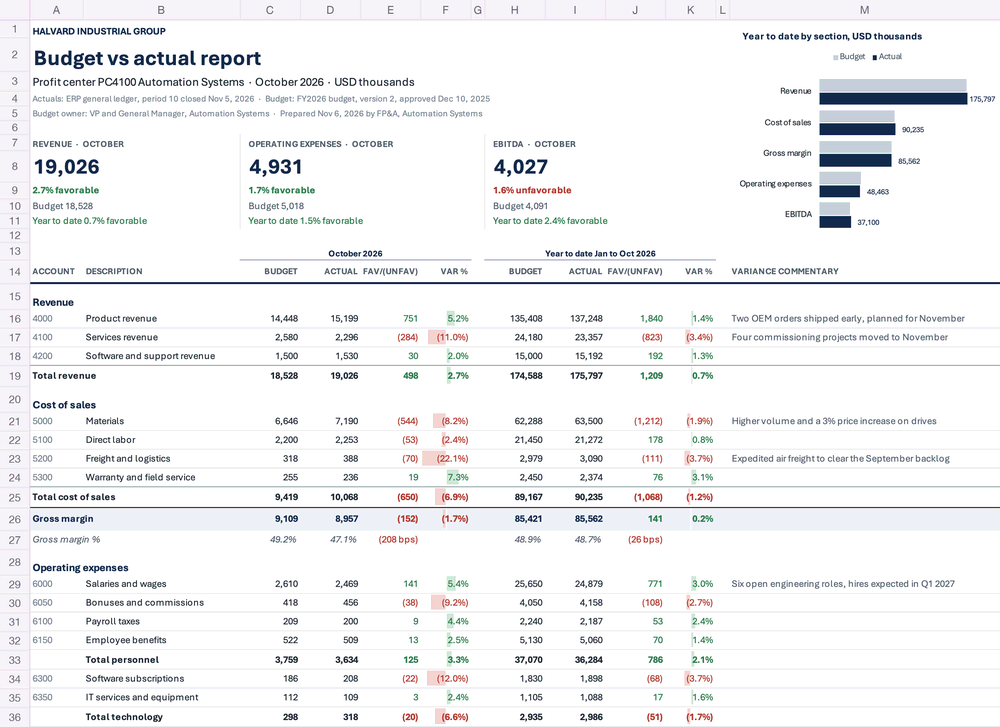
A profit center P&L with month and year-to-date variances
- Template
- XLSX
- Export as
- XLSX, PDF, ODS, CSV, HTML +19 more
- Carbone
- 5.18+
Generate budget vs actual reports from your ERP and budgeting system
After each month-end close, FP&A teams send every budget owner the same workbook: the month and the year to date, budget against actual for each account, the favorable or unfavorable variance, and the owner's commentary. The actuals come from the general ledger of the ERP, the budget from the budgeting or EPM system. Your reporting job sends both as JSON to the Carbone API and gets back one Excel file per profit center, ready for the budget owners and the leadership.
The report stays a live workbook. The subtotals, the margins and the variances are Excel formulas, so a controller can adjust an accrual and the whole P&L recomputes. Here, Halvard Industrial Group, a fictional manufacturer, reports October 2026 for its Automation Systems profit center.
In this example, you will:
- Build a header and three KPI tiles that read the totals of the P&L
- List the revenue and cost of sales accounts in loops, and the operating expenses in a nested loop (categories, then accounts)
- Compute the subtotals, the margins and the favorable/(unfavorable) variances with Excel formulas
- Color the variances and add data bars on Var % with conditional formatting
- Chart the budget against the actual of each section, year to date
How to build a budget vs actual report in Excel
1. Write the header and the KPI tiles
The header prints the company, the profit center, the period and the sources of the figures, with date formatters:
A1: {d.company.name:upperCase}
A2: Budget vs actual report{o.preReleaseFeatureIn=5018000}
A3: Profit center {d.profitCenter.code} {d.profitCenter.name}  ·  {d.period.end:formatD('MMMM YYYY')}  ·  {d.currency} thousands
A4: Actuals: {d.actuals.source}, period {d.period.fiscalPeriod} closed {d.actuals.closedOn:formatD('ll')}
The tag {o.preReleaseFeatureIn=5018000} at the end of the title prints nothing. It turns on the pre-release support of formulas, conditional formatting and charts in loops.
Each KPI tile has a label, like REVENUE · {d.period.end:formatD('MMMM'):upperCase}, and formulas that point to the total rows of the template: =D18 for the actual revenue, =F18 for its variance. Carbone moves these rows down when the loops add accounts, and updates the references. The number format 0.0%" favorable";0.0%" unfavorable" writes the variance in words, and #,##0, shows the dollars in thousands.
2. List the accounts in loops
The JSON data holds the raw figures of each account, as the general ledger and the budget give them:
{
  "period": { "fiscalYear": 2026, "fiscalPeriod": 10, "start": "2026-01-01", "end": "2026-10-31" },
  "revenue": [
    { "account": "4000", "name": "Product revenue", "monthBudget": 14448000, "monthActual": 15199287,
      "ytdBudget": 135408000, "ytdActual": 137247927, "comment": "Two OEM orders shipped early, planned for November" }
  ],
  "operatingExpenses": [
    { "name": "Personnel", "accounts": [
      { "account": "6000", "name": "Salaries and wages", "monthBudget": 2610000, "monthActual": 2468944,
        "ytdBudget": 25650000, "ytdActual": 24879062, "comment": "Six open engineering roles, hires expected in Q1 2027" }
    ] }
  ]
}- Row 16 repeats the revenue accounts with a loop:
{d.revenue[i].account},{d.revenue[i].name},{d.revenue[i].monthBudget:formatN},{d.revenue[i].monthActual:formatN},{d.revenue[i].ytdBudget:formatN},{d.revenue[i].ytdActual:formatN}and{d.revenue[i].comment}. Row 17 ends the loop with{d.revenue[i+1].account}. Rows 20 and 21 do the same for the cost of sales withd.costOfSales. - The operating expenses use a nested loop: row 26 repeats
{d.operatingExpenses[i].accounts[i].name}, row 27 ends the accounts with{d.operatingExpenses[i].accounts[i+1].account}, row 28 prints the subtotalTotal {d.operatingExpenses[i].name:lowerCase}, and row 29 ends the categories with{d.operatingExpenses[i+1].name}.
Each amount is a single :formatN tag, so Excel gets a real number and applies the number format of the cell.
3. Compute the subtotals, the margins and the variances
- Totals and margins. Total revenue is
=SUM(C16:C17): Carbone extends the range to all the generated rows. Gross margin is=C18-C22, EBITDA=C23-C30, and the margin rates=IFERROR(C23/C18,"n.m."), with their variance in basis points:=(D24-C24)*10000. - Variances. A positive variance is favorable. Revenue and margin rows compute
=D16-C16(actual minus budget), cost rows=C20-D20(budget minus actual), and Var % is=IF(C16=0,"n.m.",E16/ABS(C16)). A cost below budget is green, a revenue below budget is red, and the variances of the totals equal the sum of the variances of their lines. - Category subtotals. Hidden column N holds the category of each account,
{d.operatingExpenses[i].name}, and hidden columns P to S copy its amounts. The subtotal row sums them with absolute ranges that span the whole nested loop:=SUMIFS($P$25:$P$29,$N$25:$N$29,$N28). Carbone extends these ranges to all the generated rows. Hidden column O marks the subtotal rows, and total operating expenses adds them:=SUMIFS(C25:C29,$O$25:$O$29,"Subtotal").
Learn more about formulas in XLSX templates.
4. Color the variances
Define the conditional formatting on the template rows, and Carbone extends it to every generated row:
- The Fav/(Unfav) and Var % columns use two formula rules:
=AND(ISNUMBER(E16),E16>0)in green and=AND(ISNUMBER(E16),E16<0)in red.ISNUMBERleaves the "n.m." cells uncolored. - Var % gets data bars with a fixed scale from -15% to 15%, the axis in the middle, and red bars for the negative values: a favorable variance grows to the right, an unfavorable one to the left.
- The KPI tiles use two cell value rules, greater than 0 and less than 0.
5. Chart the sections
Hidden cells U7 to W11 read the year-to-date budget and actual of each section from the total rows, like =H18 and =I18. The bar chart uses these cells, with Show data in hidden rows and columns turned on. It sits in column M, above the table, so the rows added by the loops do not move it. Learn more about charts in XLSX templates.
The print setup fits the report to the width of a landscape page, repeats the column headers on each page, and prints the company and "Page X of Y" in the header and footer. The header uses {d.company.name}, like the cells.
Related Examples
Trusted by 800+ paid customers in 40+ countries