
Design
XLSX templates
Design a report in Excel, add Carbone tags, and generate it from JSON data as an Excel file or a PDF.
COMMUNITY FEATURE
Available for:
Carbone Cloud
Carbone On-premise
Embedded Carbone JS
v2.0+
Any XLSX file can be a template. Write Carbone tags in the cells, send your JSON data to the API, and get back an Excel file or a PDF with the layout of the template.
Basic
Write a tag in a cell to insert a value from the JSON data. In {d.company}, d is the root of the data. A cell can mix text and tags, as in row 8.
{
  "title": "Q3 2026 sales report",
  "company": "Acme Corporation",
  "manager": "Jane Smith",
  "region": "North America",
  "period": "July to September 2026",
  "date": "2026-10-05"
}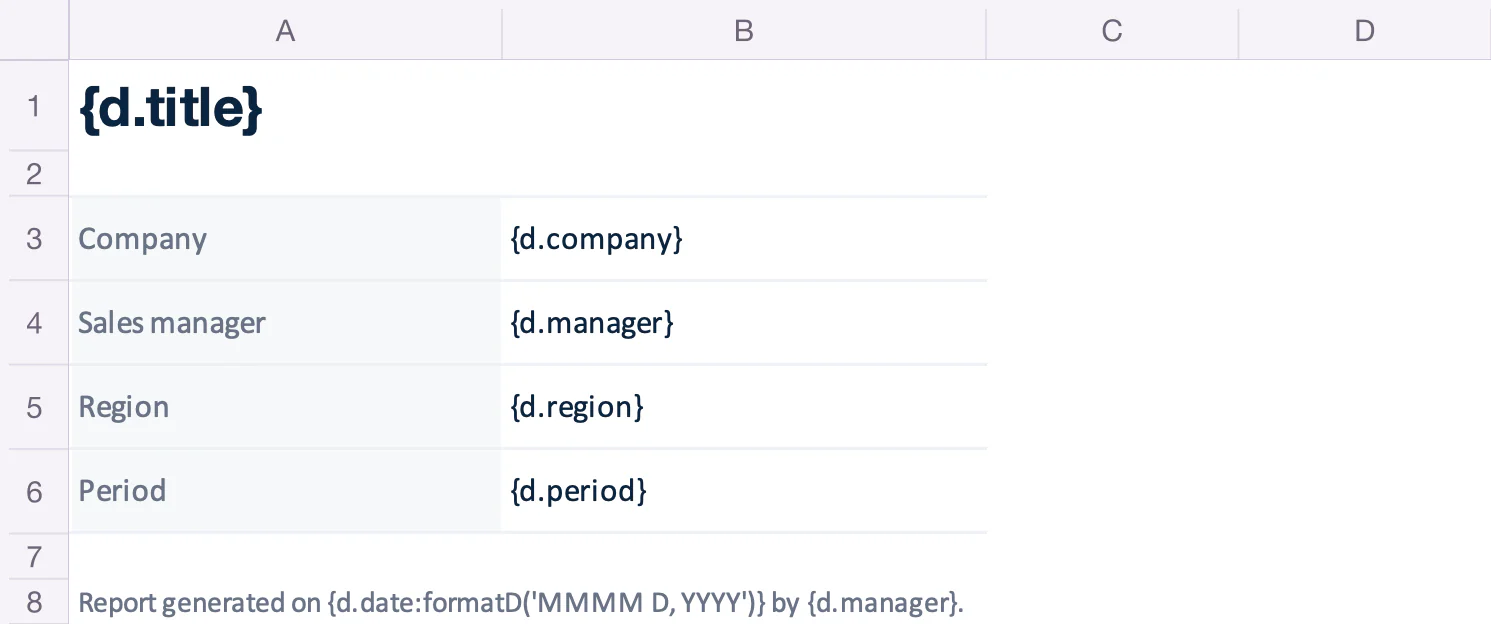
| Row | A | B |
|---|---|---|
| 1 | {d.title} | |
| 3 | Company | {d.company} |
| 4 | Sales manager | {d.manager} |
| 5 | Region | {d.region} |
| 6 | Period | {d.period} |
| 8 | Report generated on {d.date:formatD('MMMM D, YYYY')} by {d.manager}. |
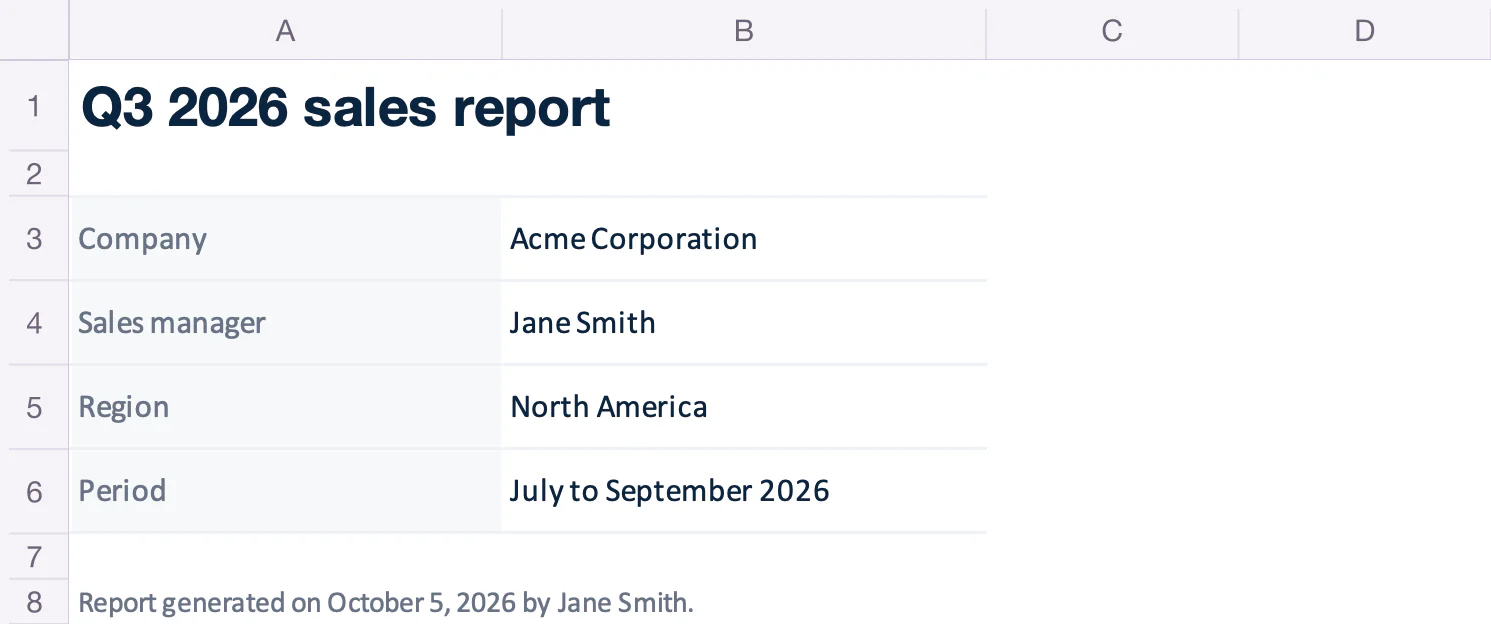
| Row | A | B |
|---|---|---|
| 1 | Q3 2026 sales report | |
| 3 | Company | Acme Corporation |
| 4 | Sales manager | Jane Smith |
| 5 | Region | North America |
| 6 | Period | July to September 2026 |
| 8 | Report generated on October 5, 2026 by Jane Smith. |
Loops
A loop repeats a row for each item in an array. The template needs two rows:
- The row to repeat, with
[i]in its tags:{d.products[i].name}. - The next row, with
[i+1]in one cell:{d.products[i+1].name}. It marks the end of the loop and is removed from the report.
Carbone copies the row with its styles and height, and moves the rows below it down, like the total in row 6.
{
  "title": "Q3 2026 sales",
  "total": 21140,
  "products": [
    { "name": "Laptop",          "category": "Hardware", "qty": 12, "price": 950, "amount": 11400, "status": "In stock" },
    { "name": "27-inch monitor", "category": "Hardware", "qty": 25, "price": 240, "amount": 6000,  "status": "Out of stock" },
    { "name": "Keyboard",        "category": "Hardware", "qty": 60, "price": 35,  "amount": 2100,  "status": "In stock" },
    { "name": "Mouse",           "category": "Hardware", "qty": 80, "price": 12,  "amount": 960,   "status": "Backorder" },
    { "name": "Office license",  "category": "Software", "qty": 4,  "price": 99,  "amount": 396,   "status": "In stock" },
    { "name": "Antivirus",       "category": "Software", "qty": 3,  "price": 45,  "amount": 135,   "status": "Out of stock" },
    { "name": "Cloud backup",    "category": "Software", "qty": 1,  "price": 60,  "amount": 60,    "status": "In stock" },
    { "name": "Installation",    "category": "Services", "qty": 1,  "price": 50,  "amount": 50,    "status": "Backorder" },
    { "name": "Training",        "category": "Services", "qty": 1,  "price": 30,  "amount": 30,    "status": "In stock" },
    { "name": "Maintenance",     "category": "Services", "qty": 1,  "price": 9,   "amount": 9,     "status": "Out of stock" }
  ]
}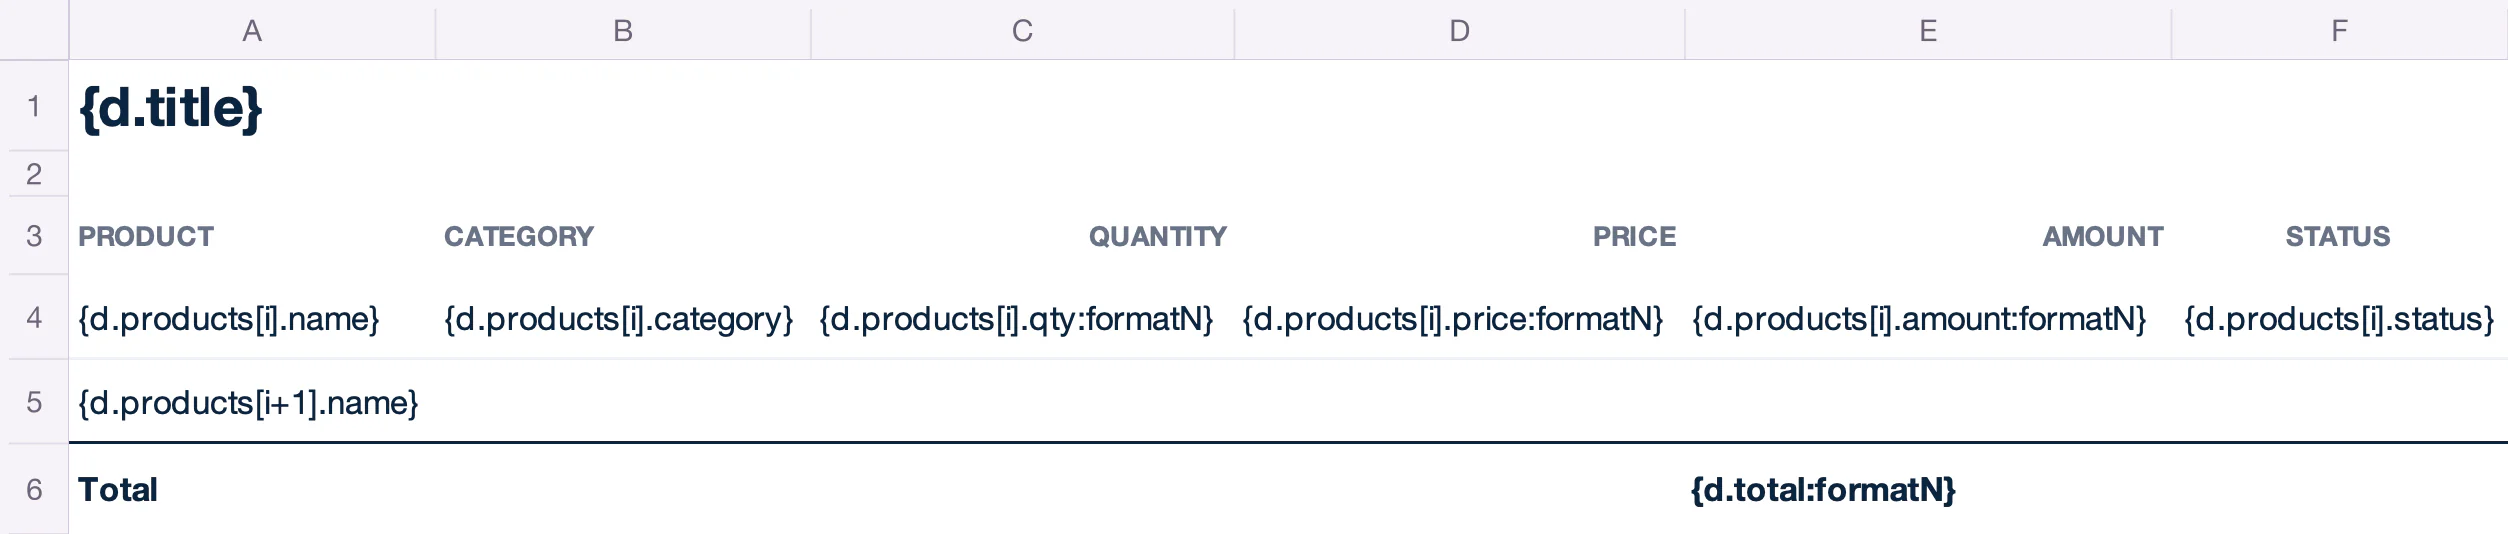
| Row | A | B | C | D | E | F |
|---|---|---|---|---|---|---|
| 1 | {d.title} | |||||
| 3 | PRODUCT | CATEGORY | QUANTITY | PRICE | AMOUNT | STATUS |
| 4 | {d.products[i].name} | {d.products[i].category} | {d.products[i].qty:formatN} | {d.products[i].price:formatN} | {d.products[i].amount:formatN} | {d.products[i].status} |
| 5 | {d.products[i+1].name} | |||||
| 6 | Total | {d.total:formatN} |
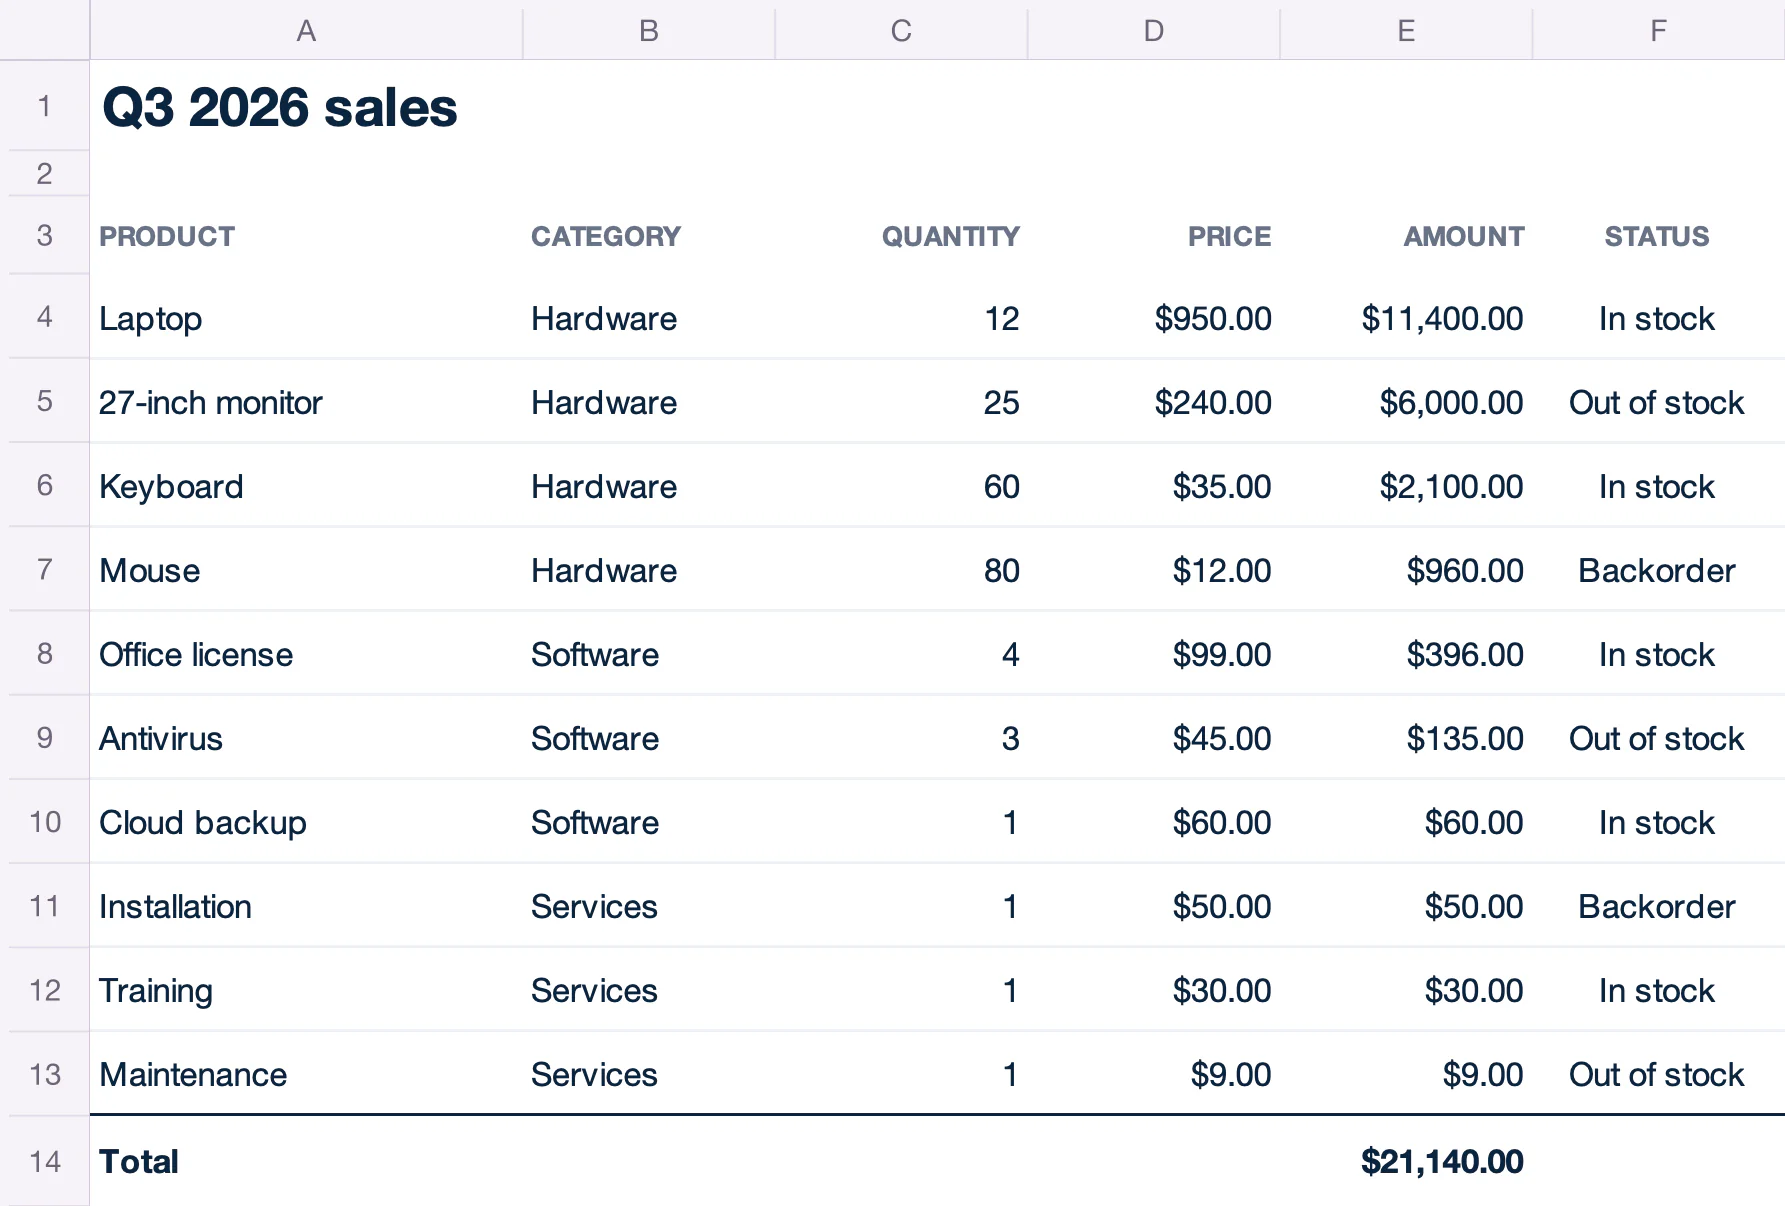
| Row | A | B | C | D | E | F |
|---|---|---|---|---|---|---|
| 1 | Q3 2026 sales | |||||
| 3 | PRODUCT | CATEGORY | QUANTITY | PRICE | AMOUNT | STATUS |
| 4 | Laptop | Hardware | 12 | 950 | 11400 | In stock |
| 5 | 27-inch monitor | Hardware | 25 | 240 | 6000 | Out of stock |
| 6 | Keyboard | Hardware | 60 | 35 | 2100 | In stock |
| 7 | Mouse | Hardware | 80 | 12 | 960 | Backorder |
| 8 | Office license | Software | 4 | 99 | 396 | In stock |
| 9 | Antivirus | Software | 3 | 45 | 135 | Out of stock |
| 10 | Cloud backup | Software | 1 | 60 | 60 | In stock |
| 11 | Installation | Services | 1 | 50 | 50 | Backorder |
| 12 | Training | Services | 1 | 30 | 30 | In stock |
| 13 | Maintenance | Services | 1 | 9 | 9 | Out of stock |
| 14 | Total | 21140 |
Frozen panes stay in place, so freeze only the rows above the loop.
Sort and filter
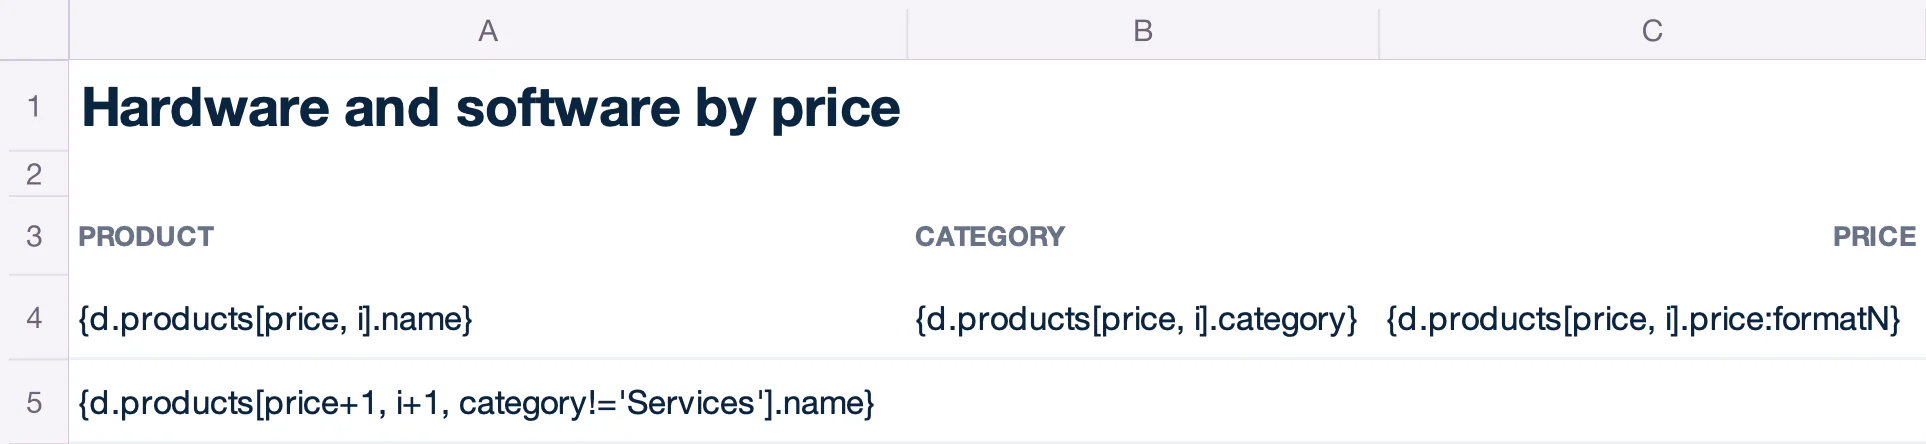
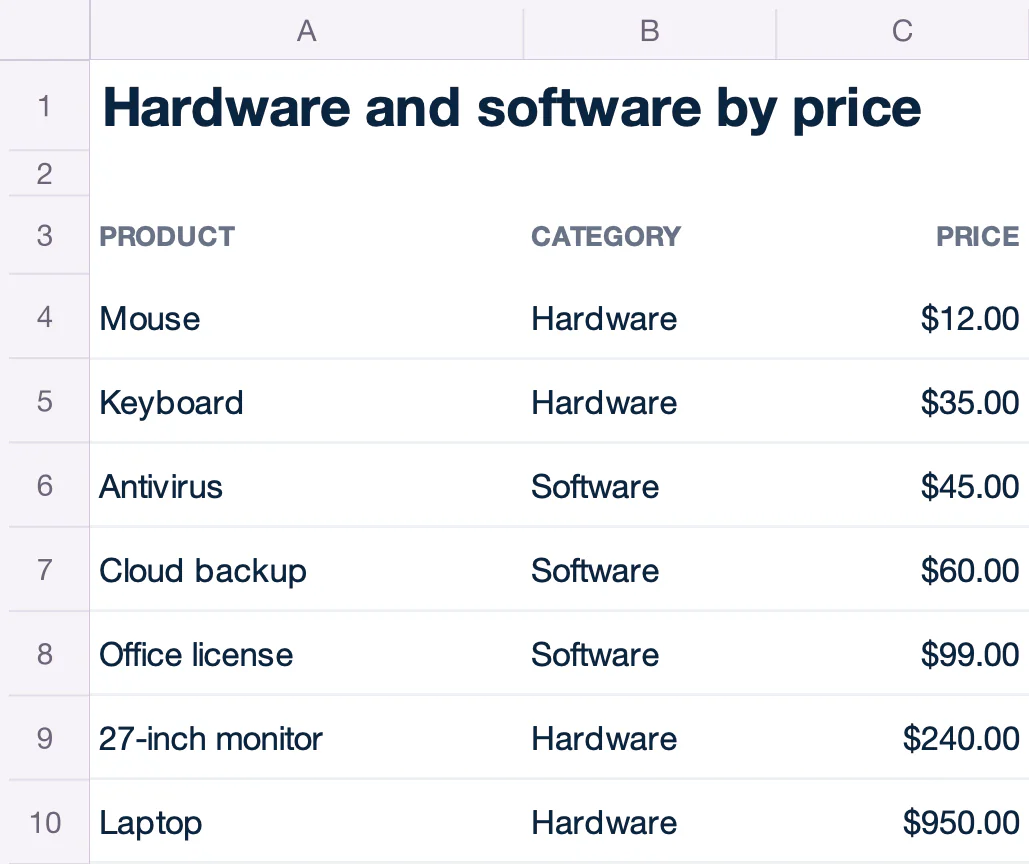
Add an attribute before i to sort the rows: {d.products[price, i].name} sorts the products by ascending price, and the end tag becomes [price+1, i+1]. Add a condition to the [i+1] tag to filter them: category!='Services' removes the services. Learn more about sorting and filtering.
{
  "title": "Q3 2026 sales",
  "total": 21140,
  "products": [
    { "name": "Laptop",          "category": "Hardware", "qty": 12, "price": 950, "amount": 11400, "status": "In stock" },
    { "name": "27-inch monitor", "category": "Hardware", "qty": 25, "price": 240, "amount": 6000,  "status": "Out of stock" },
    { "name": "Keyboard",        "category": "Hardware", "qty": 60, "price": 35,  "amount": 2100,  "status": "In stock" },
    { "name": "Mouse",           "category": "Hardware", "qty": 80, "price": 12,  "amount": 960,   "status": "Backorder" },
    { "name": "Office license",  "category": "Software", "qty": 4,  "price": 99,  "amount": 396,   "status": "In stock" },
    { "name": "Antivirus",       "category": "Software", "qty": 3,  "price": 45,  "amount": 135,   "status": "Out of stock" },
    { "name": "Cloud backup",    "category": "Software", "qty": 1,  "price": 60,  "amount": 60,    "status": "In stock" },
    { "name": "Installation",    "category": "Services", "qty": 1,  "price": 50,  "amount": 50,    "status": "Backorder" },
    { "name": "Training",        "category": "Services", "qty": 1,  "price": 30,  "amount": 30,    "status": "In stock" },
    { "name": "Maintenance",     "category": "Services", "qty": 1,  "price": 9,   "amount": 9,     "status": "Out of stock" }
  ]
}
| Row | A | B | C |
|---|---|---|---|
| 1 | Hardware and software by price | ||
| 3 | PRODUCT | CATEGORY | PRICE |
| 4 | {d.products[price, i].name} | {d.products[price, i].category} | {d.products[price, i].price:formatN} |
| 5 | {d.products[price+1, i+1, category!='Services'].name} |
| Row | A | B | C |
|---|---|---|---|
| 1 | Hardware and software by price | ||
| 3 | PRODUCT | CATEGORY | PRICE |
| 4 | Mouse | Hardware | 12 |
| 5 | Keyboard | Hardware | 35 |
| 6 | Antivirus | Software | 45 |
| 7 | Cloud backup | Software | 60 |
| 8 | Office license | Software | 99 |
| 9 | 27-inch monitor | Hardware | 240 |
| 10 | Laptop | Hardware | 950 |
Nested loops
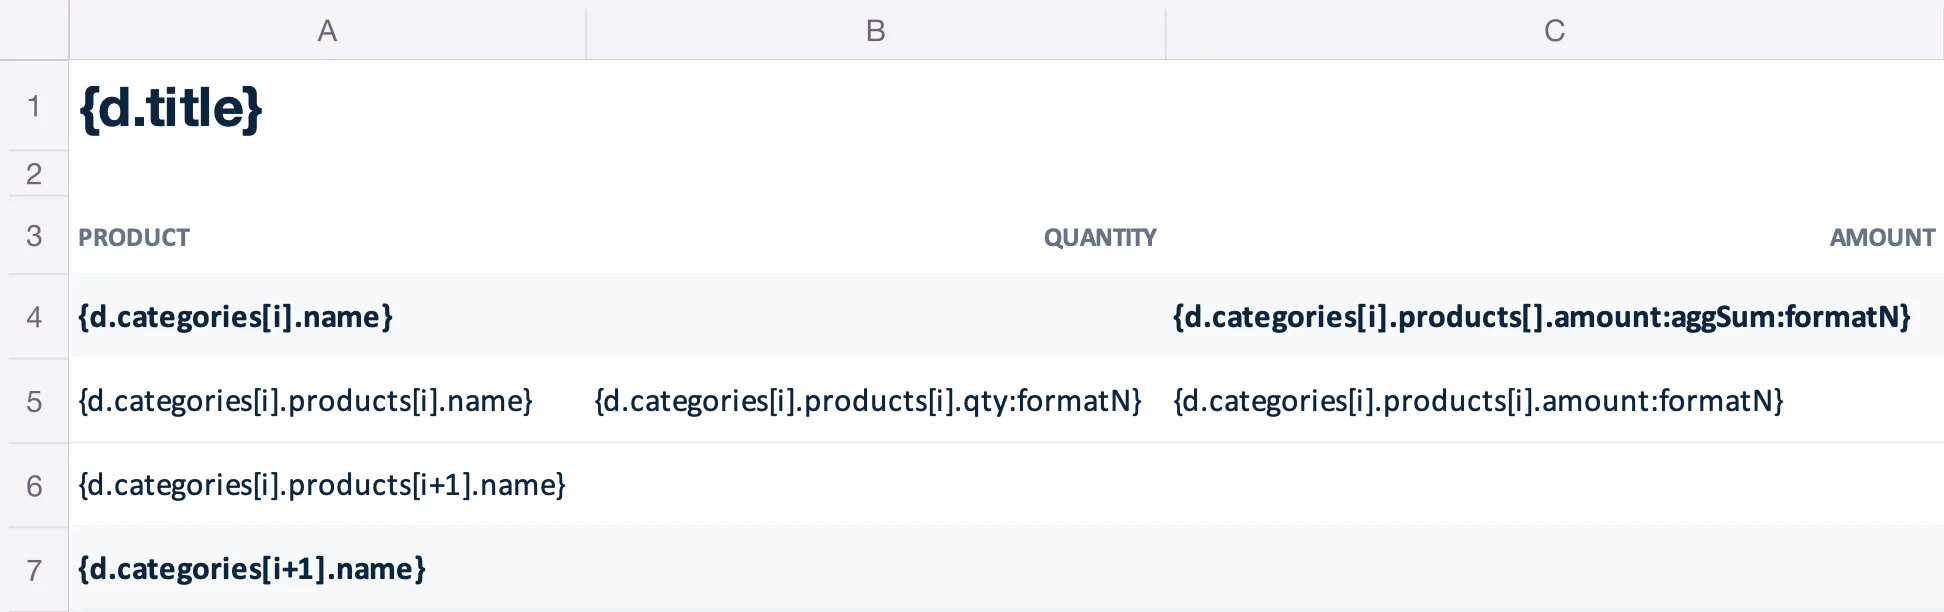
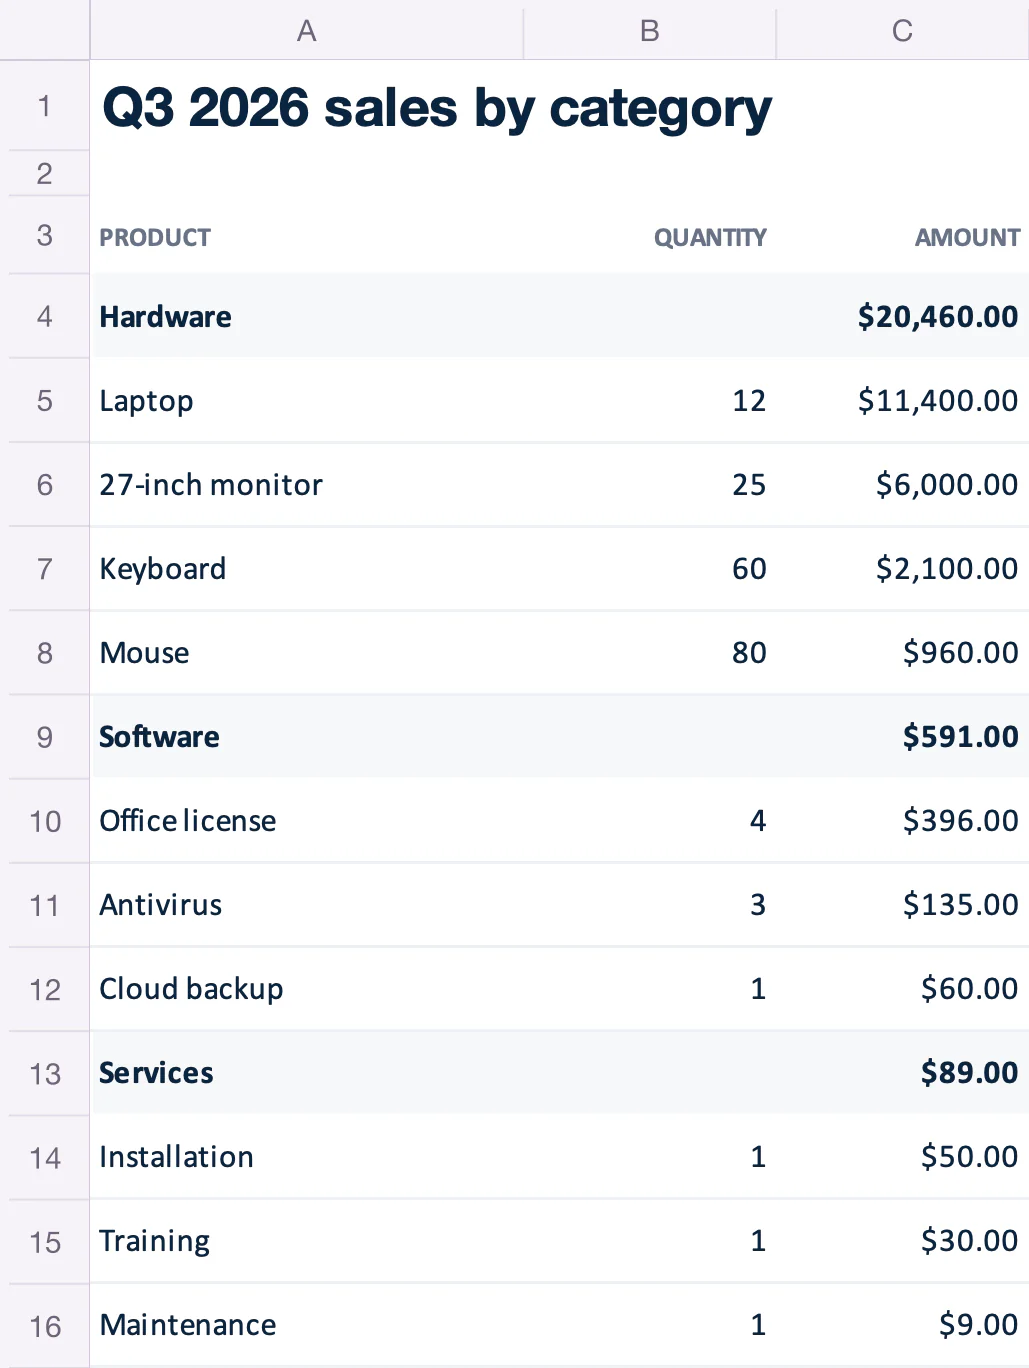
A loop can contain another loop to group rows. {d.categories[i].name} repeats the categories, and {d.categories[i].products[i].name} repeats the products of each category. The [i+1] row of the categories closes the outer loop.
{
  "title": "Q3 2026 sales by category",
  "categories": [
    {
      "name": "Hardware",
      "products": [
        {
          "name": "Laptop",
          "qty": 12,
          "amount": 11400
        },
        {
          "name": "27-inch monitor",
          "qty": 25,
          "amount": 6000
        },
        {
          "name": "Keyboard",
          "qty": 60,
          "amount": 2100
        },
        {
          "name": "Mouse",
          "qty": 80,
          "amount": 960
        }
      ]
    },
    {
      "name": "Software",
      "products": [
        {
          "name": "Office license",
          "qty": 4,
          "amount": 396
        },
        {
          "name": "Antivirus",
          "qty": 3,
          "amount": 135
        },
        {
          "name": "Cloud backup",
          "qty": 1,
          "amount": 60
        }
      ]
    },
    {
      "name": "Services",
      "products": [
        {
          "name": "Installation",
          "qty": 1,
          "amount": 50
        },
        {
          "name": "Training",
          "qty": 1,
          "amount": 30
        },
        {
          "name": "Maintenance",
          "qty": 1,
          "amount": 9
        }
      ]
    }
  ]
}
| Row | A | B | C |
|---|---|---|---|
| 1 | {d.title} | ||
| 3 | PRODUCT | QUANTITY | AMOUNT |
| 4 | {d.categories[i].name} | {d.categories[i].products[].amount:aggSum:formatN} | |
| 5 | {d.categories[i].products[i].name} | {d.categories[i].products[i].qty:formatN} | {d.categories[i].products[i].amount:formatN} |
| 6 | {d.categories[i].products[i+1].name} | ||
| 7 | {d.categories[i+1].name} |
| Row | A | B | C |
|---|---|---|---|
| 1 | Q3 2026 sales by category | ||
| 3 | PRODUCT | QUANTITY | AMOUNT |
| 4 | Hardware | 20460 | |
| 5 | Laptop | 12 | 11400 |
| 6 | 27-inch monitor | 25 | 6000 |
| 7 | Keyboard | 60 | 2100 |
| 8 | Mouse | 80 | 960 |
| 9 | Software | 591 | |
| 10 | Office license | 4 | 396 |
| 11 | Antivirus | 3 | 135 |
| 12 | Cloud backup | 1 | 60 |
| 13 | Services | 89 | |
| 14 | Installation | 1 | 50 |
| 15 | Training | 1 | 30 |
| 16 | Maintenance | 1 | 9 |
Horizontal loops
Write the [i] and [i+1] tags in two adjacent columns to repeat columns instead of rows. Each row of the loop needs its own [i+1] tag. Learn more about horizontal loops.
{
  "title": "Q3 2026 sales by month",
  "months": [
    {
      "name": "July",
      "orders": 120,
      "amount": 6840
    },
    {
      "name": "August",
      "orders": 98,
      "amount": 5320
    },
    {
      "name": "September",
      "orders": 143,
      "amount": 8980
    }
  ]
}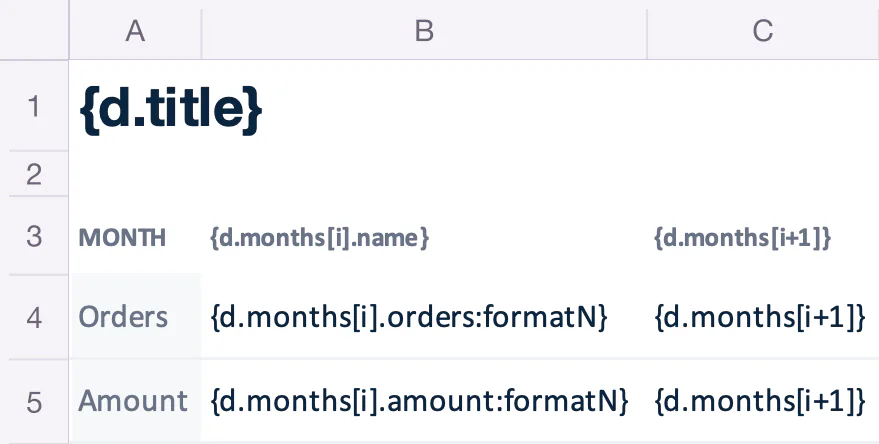
| Row | A | B | C |
|---|---|---|---|
| 1 | {d.title} | ||
| 3 | MONTH | {d.months[i].name} | {d.months[i+1]} |
| 4 | Orders | {d.months[i].orders:formatN} | {d.months[i+1]} |
| 5 | Amount | {d.months[i].amount:formatN} | {d.months[i+1]} |
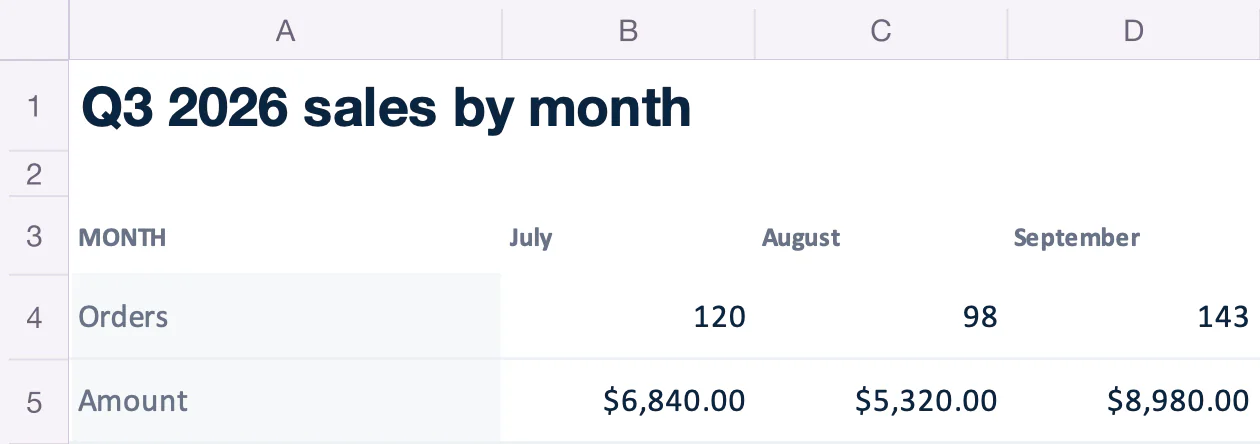
| Row | A | B | C | D |
|---|---|---|---|---|
| 1 | Q3 2026 sales by month | |||
| 3 | MONTH | July | August | September |
| 4 | Orders | 120 | 98 | 143 |
| 5 | Amount | 6840 | 5320 | 8980 |
Numbers and dates
A cell becomes a native Excel number when it contains a single tag ending with :formatN, like {d.amount:formatN}. Carbone writes the raw value, and the number format of the cell displays it. Excel can then sum, sort and chart it. The decimals come from the number format, not from the precision argument.
Other formatters write text, formatted for the language of the report: :formatC for currencies, :formatN(2, acc) for accounting amounts like (1,234.50), and :formatD for dates. To keep an accounting amount as a number, use :formatN with the cell format #,##0.00;(#,##0.00).
{
  "amount": 1234.5,
  "balance": -1234.5,
  "rate": 0.125,
  "date": "2026-11-10"
}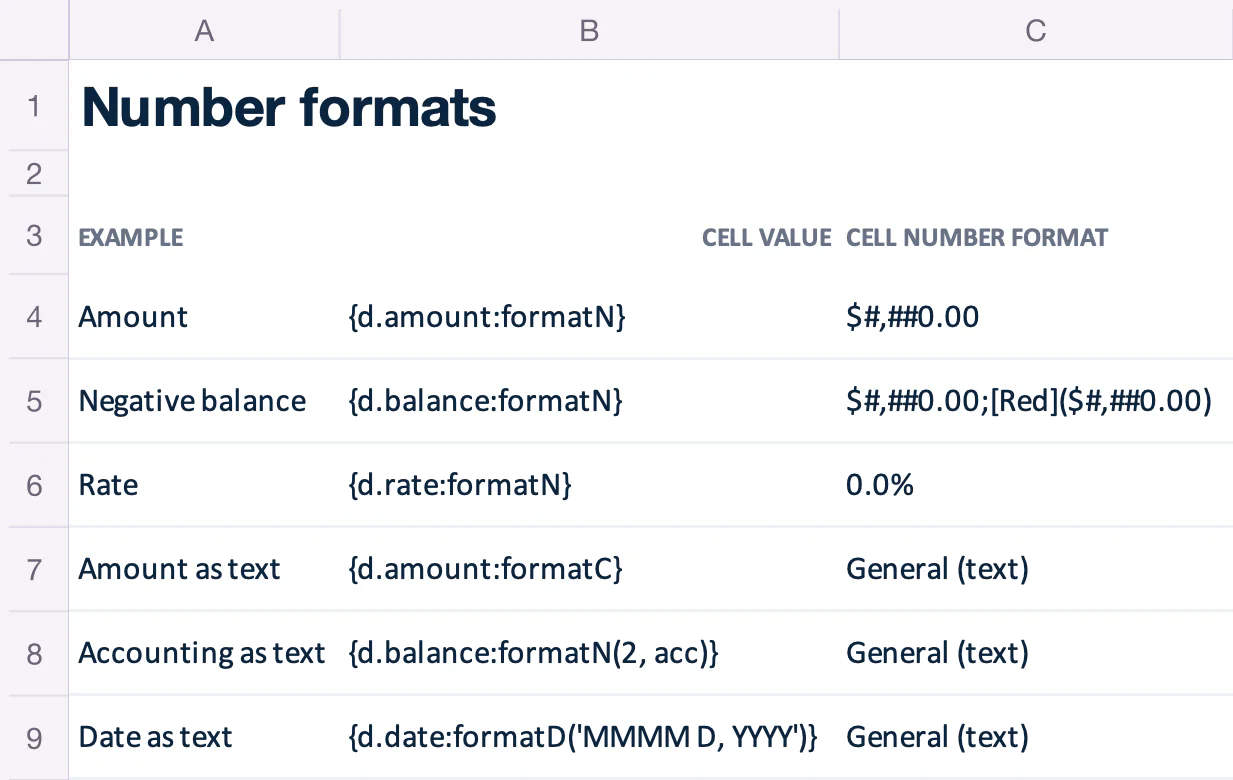
| Row | A | B | C |
|---|---|---|---|
| 1 | Number formats | ||
| 3 | EXAMPLE | CELL VALUE | CELL NUMBER FORMAT |
| 4 | Amount | {d.amount:formatN} | $#,##0.00 |
| 5 | Negative balance | {d.balance:formatN} | $#,##0.00;[Red]($#,##0.00) |
| 6 | Rate | {d.rate:formatN} | 0.0% |
| 7 | Amount as text | {d.amount:formatC} | General (text) |
| 8 | Accounting as text | {d.balance:formatN(2, acc)} | General (text) |
| 9 | Date as text | {d.date:formatD('MMMM D, YYYY')} | General (text) |
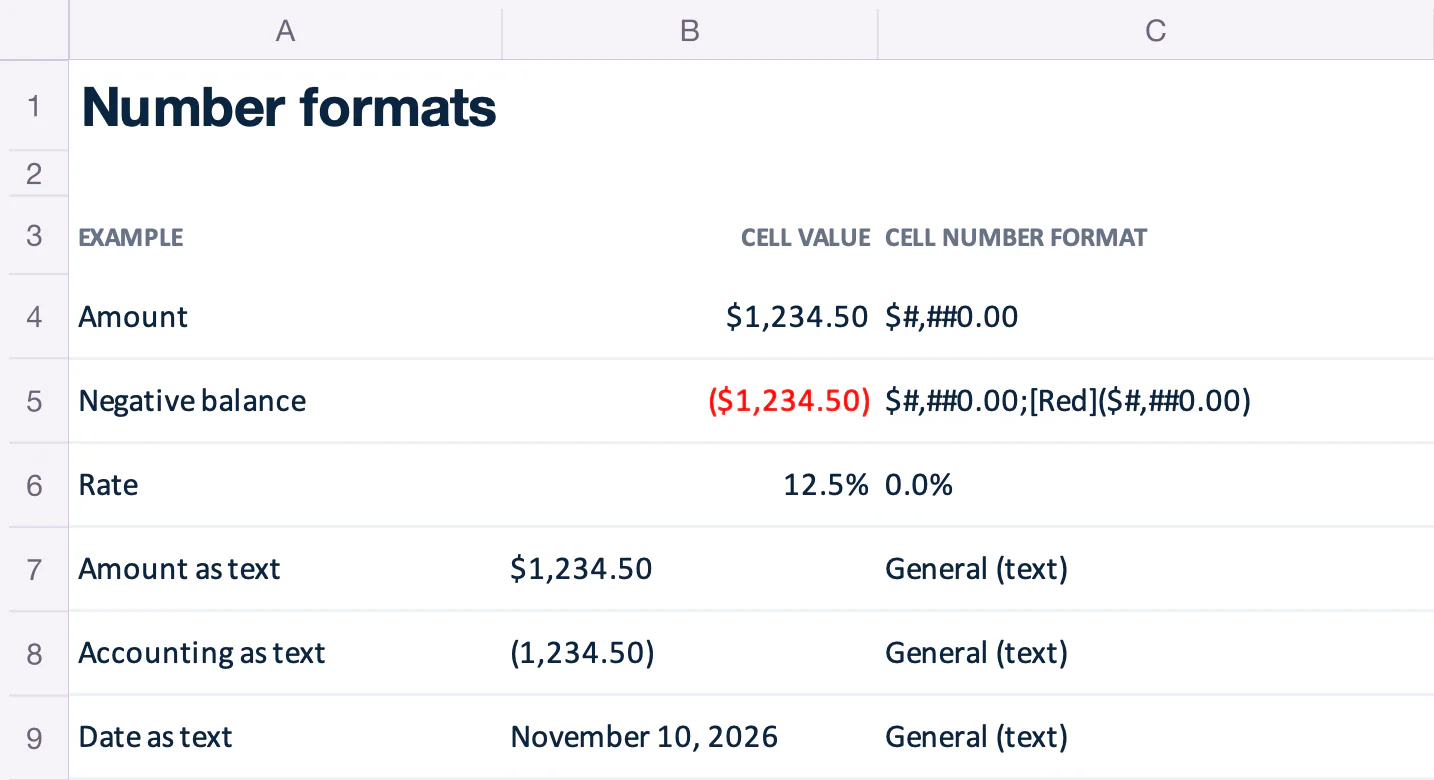
| Row | A | B | C |
|---|---|---|---|
| 1 | Number formats | ||
| 3 | EXAMPLE | CELL VALUE | CELL NUMBER FORMAT |
| 4 | Amount | 1234.5 | $#,##0.00 |
| 5 | Negative balance | -1234.5 | $#,##0.00;[Red]($#,##0.00) |
| 6 | Rate | 0.125 | 0.0% |
| 7 | Amount as text | $1,234.50 | General (text) |
| 8 | Accounting as text | (1,234.50) | General (text) |
| 9 | Date as text | November 10, 2026 | General (text) |
To write :formatN values as text instead, add {o.exportFormattedValuesAsText=true} to the template. Learn more about the number, currency and date formatters.
Conditions
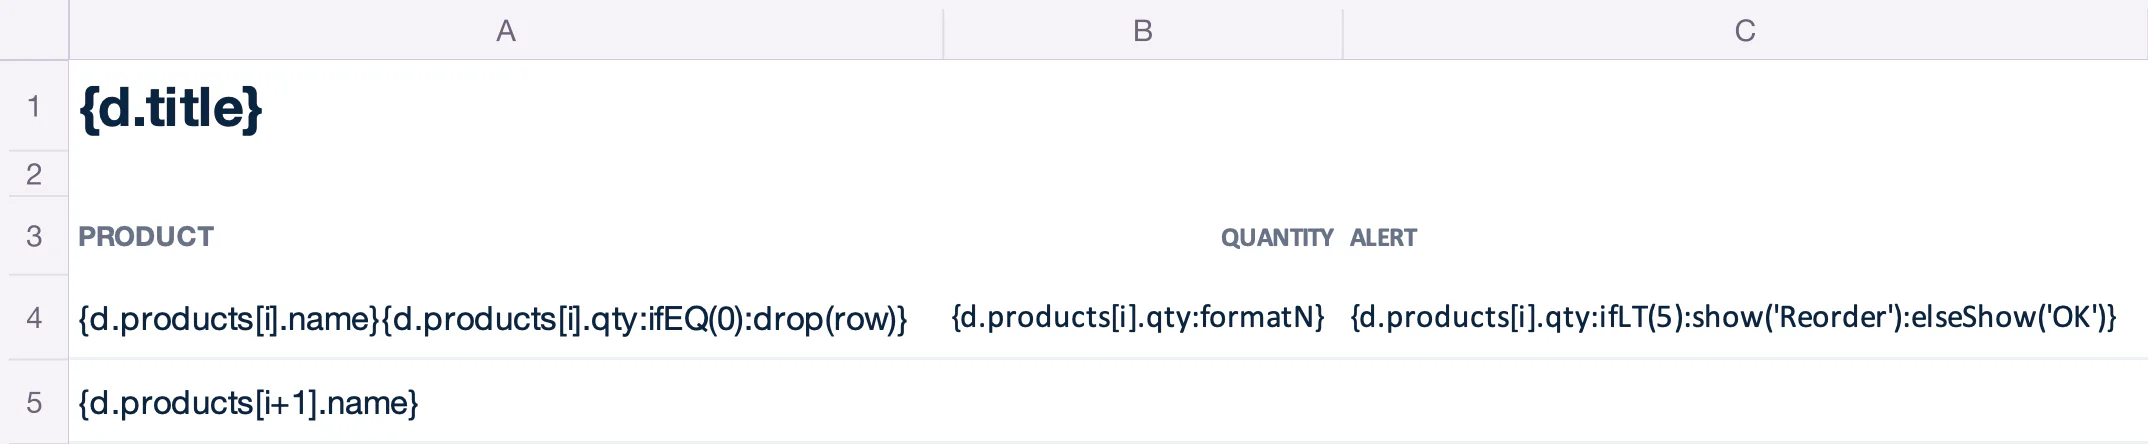
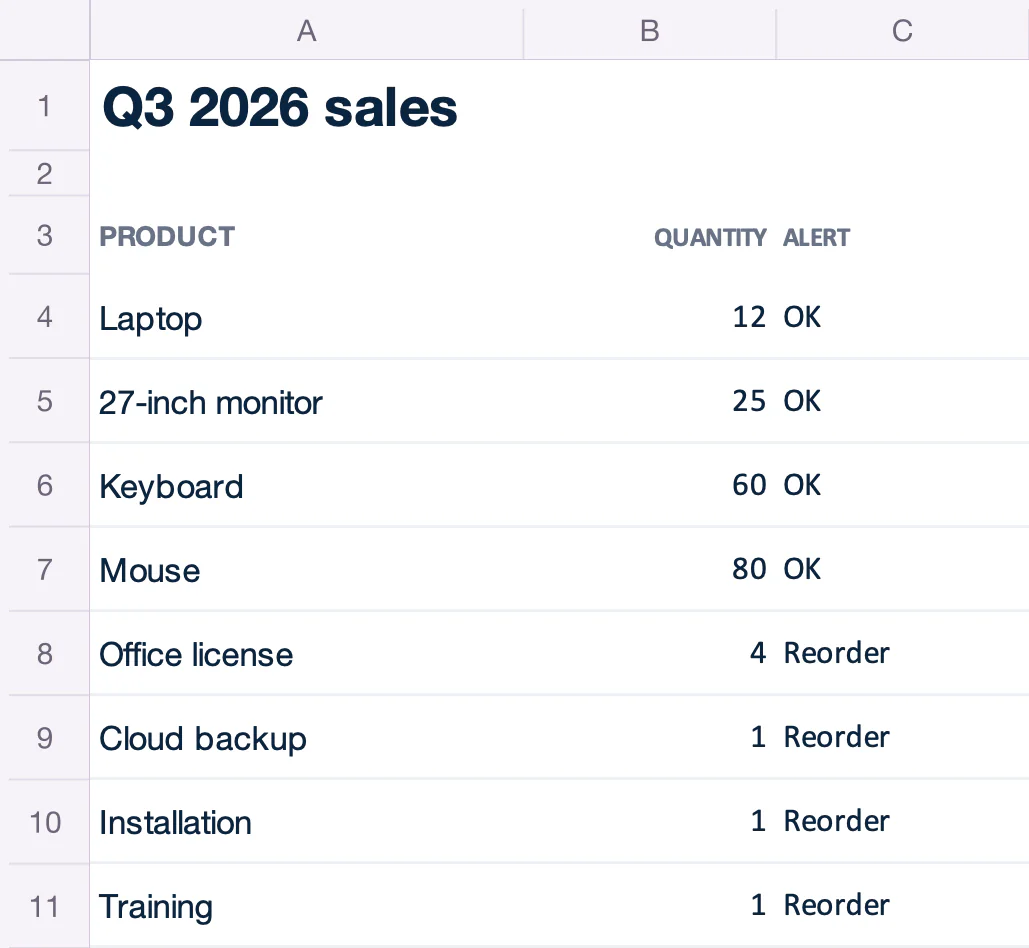
Conditions print a value or remove a row based on the data:
- Inline conditions print one value or another:
{d.products[i].qty:ifLT(5):show('Reorder'):elseShow('OK')}. - Smart conditions remove the row:
{d.products[i].qty:ifEQ(0):drop(row)}removes out-of-stock products.
{
  "title": "Q3 2026 sales",
  "total": 21140,
  "products": [
    {
      "name": "Laptop",
      "category": "Hardware",
      "qty": 12,
      "price": 950,
      "amount": 11400,
      "status": "In stock"
    },
    {
      "name": "27-inch monitor",
      "category": "Hardware",
      "qty": 25,
      "price": 240,
      "amount": 6000,
      "status": "Out of stock"
    },
    {
      "name": "Keyboard",
      "category": "Hardware",
      "qty": 60,
      "price": 35,
      "amount": 2100,
      "status": "In stock"
    },
    {
      "name": "Mouse",
      "category": "Hardware",
      "qty": 80,
      "price": 12,
      "amount": 960,
      "status": "Backorder"
    },
    {
      "name": "Office license",
      "category": "Software",
      "qty": 4,
      "price": 99,
      "amount": 396,
      "status": "In stock"
    },
    {
      "name": "Antivirus",
      "category": "Software",
      "qty": 0,
      "price": 45,
      "amount": 135,
      "status": "Out of stock"
    },
    {
      "name": "Cloud backup",
      "category": "Software",
      "qty": 1,
      "price": 60,
      "amount": 60,
      "status": "In stock"
    },
    {
      "name": "Installation",
      "category": "Services",
      "qty": 1,
      "price": 50,
      "amount": 50,
      "status": "Backorder"
    },
    {
      "name": "Training",
      "category": "Services",
      "qty": 1,
      "price": 30,
      "amount": 30,
      "status": "In stock"
    },
    {
      "name": "Maintenance",
      "category": "Services",
      "qty": 0,
      "price": 9,
      "amount": 9,
      "status": "Out of stock"
    }
  ]
}
| Row | A | B | C |
|---|---|---|---|
| 1 | {d.title} | ||
| 3 | PRODUCT | QUANTITY | ALERT |
| 4 | {d.products[i].name}{d.products[i].qty:ifEQ(0):drop(row)} | {d.products[i].qty:formatN} | {d.products[i].qty:ifLT(5):show('Reorder'):elseShow('OK')} |
| 5 | {d.products[i+1].name} |
| Row | A | B | C |
|---|---|---|---|
| 1 | Q3 2026 sales | ||
| 3 | PRODUCT | QUANTITY | ALERT |
| 4 | Laptop | 12 | OK |
| 5 | 27-inch monitor | 25 | OK |
| 6 | Keyboard | 60 | OK |
| 7 | Mouse | 80 | OK |
| 8 | Office license | 4 | Reorder |
| 9 | Cloud backup | 1 | Reorder |
| 10 | Installation | 1 | Reorder |
| 11 | Training | 1 | Reorder |
Learn more about inline conditions and smart conditions.
Totals
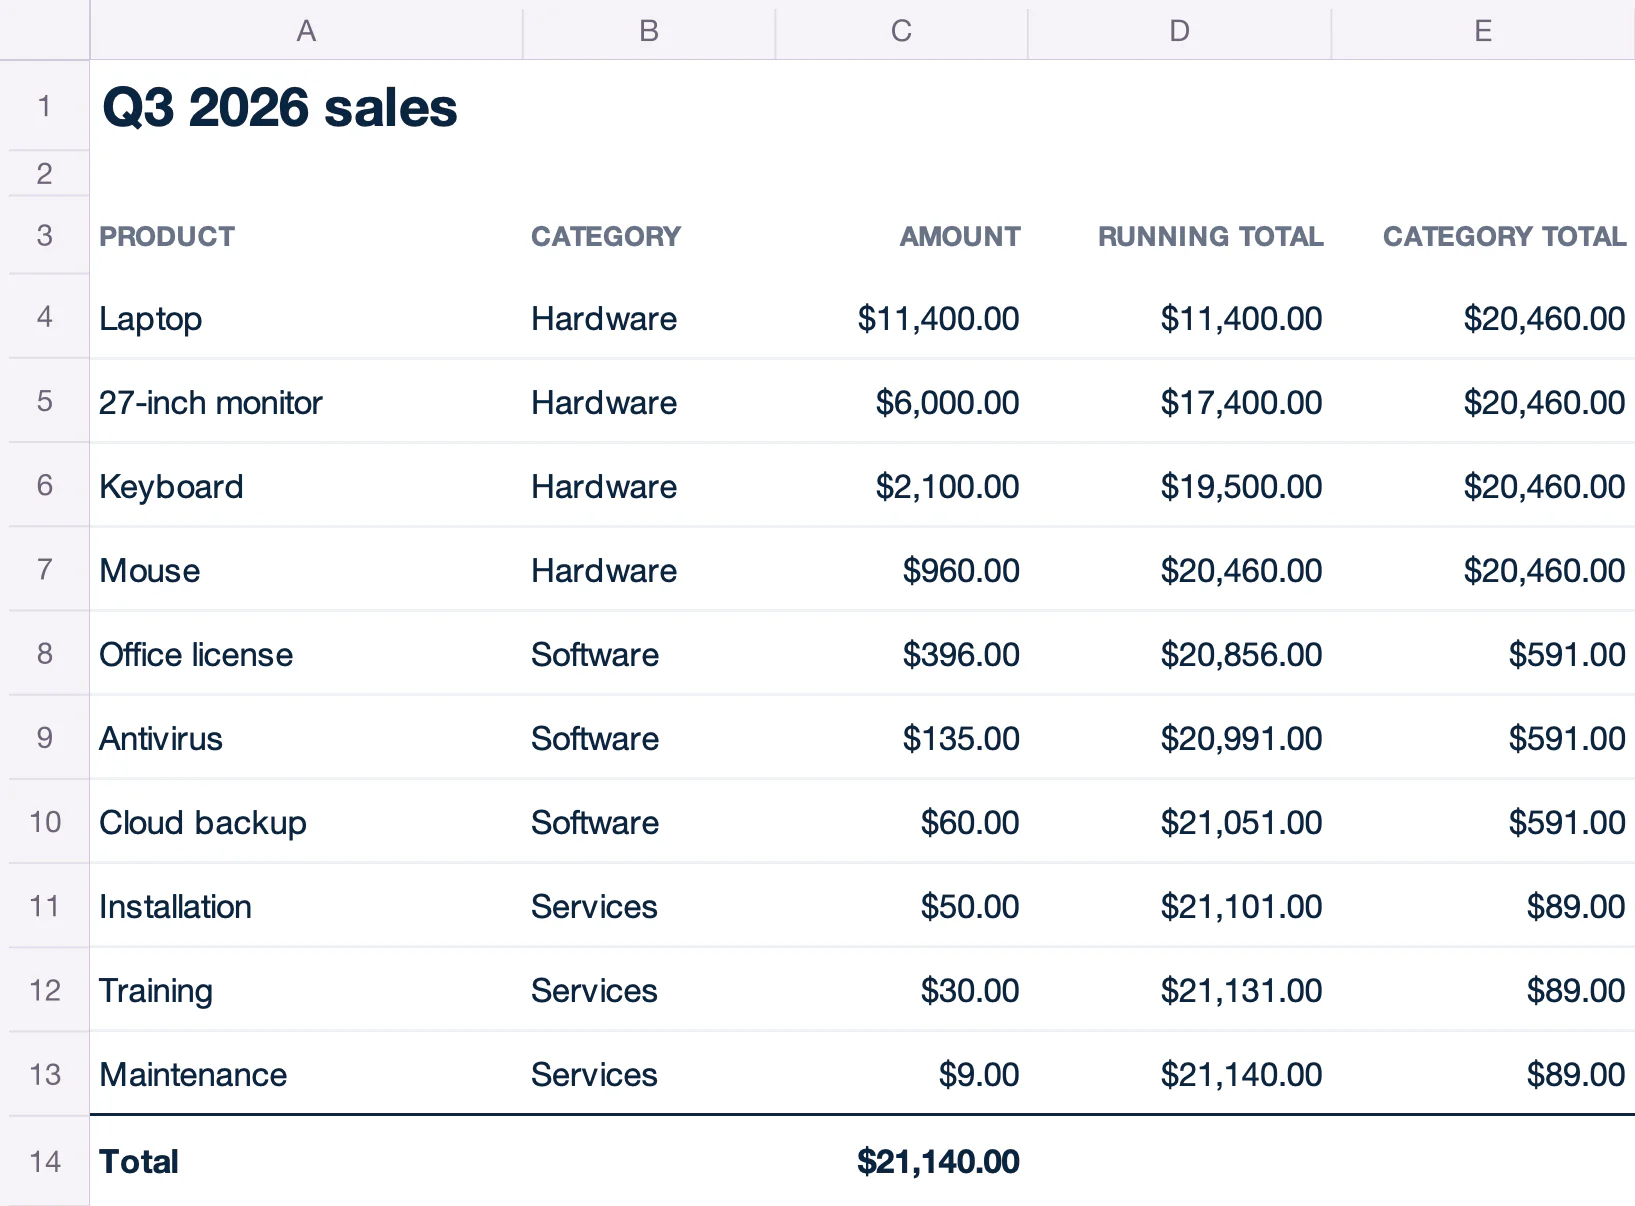
Aggregators compute totals without Excel formulas. :aggSum sums a column, :aggSum(.category) sums each category, and :cumSum prints a running total. Add :formatN to get native numbers. Totals match the rows after sorting or filtering, and stay correct in PDF and CSV outputs.
{
  "title": "Q3 2026 sales",
  "total": 21140,
  "products": [
    { "name": "Laptop",          "category": "Hardware", "qty": 12, "price": 950, "amount": 11400, "status": "In stock" },
    { "name": "27-inch monitor", "category": "Hardware", "qty": 25, "price": 240, "amount": 6000,  "status": "Out of stock" },
    { "name": "Keyboard",        "category": "Hardware", "qty": 60, "price": 35,  "amount": 2100,  "status": "In stock" },
    { "name": "Mouse",           "category": "Hardware", "qty": 80, "price": 12,  "amount": 960,   "status": "Backorder" },
    { "name": "Office license",  "category": "Software", "qty": 4,  "price": 99,  "amount": 396,   "status": "In stock" },
    { "name": "Antivirus",       "category": "Software", "qty": 3,  "price": 45,  "amount": 135,   "status": "Out of stock" },
    { "name": "Cloud backup",    "category": "Software", "qty": 1,  "price": 60,  "amount": 60,    "status": "In stock" },
    { "name": "Installation",    "category": "Services", "qty": 1,  "price": 50,  "amount": 50,    "status": "Backorder" },
    { "name": "Training",        "category": "Services", "qty": 1,  "price": 30,  "amount": 30,    "status": "In stock" },
    { "name": "Maintenance",     "category": "Services", "qty": 1,  "price": 9,   "amount": 9,     "status": "Out of stock" }
  ]
}
| Row | A | B | C | D | E |
|---|---|---|---|---|---|
| 1 | {d.title} | ||||
| 3 | PRODUCT | CATEGORY | AMOUNT | RUNNING TOTAL | CATEGORY TOTAL |
| 4 | {d.products[i].name} | {d.products[i].category} | {d.products[i].amount:formatN} | {d.products[i].amount:cumSum:formatN} | {d.products[i].amount:aggSum(.category):formatN} |
| 5 | {d.products[i+1].name} | ||||
| 6 | Total | {d.products[].amount:aggSum:formatN} |
| Row | A | B | C | D | E |
|---|---|---|---|---|---|
| 1 | Q3 2026 sales | ||||
| 3 | PRODUCT | CATEGORY | AMOUNT | RUNNING TOTAL | CATEGORY TOTAL |
| 4 | Laptop | Hardware | 11400 | 11400 | 20460 |
| 5 | 27-inch monitor | Hardware | 6000 | 17400 | 20460 |
| 6 | Keyboard | Hardware | 2100 | 19500 | 20460 |
| 7 | Mouse | Hardware | 960 | 20460 | 20460 |
| 8 | Office license | Software | 396 | 20856 | 591 |
| 9 | Antivirus | Software | 135 | 20991 | 591 |
| 10 | Cloud backup | Software | 60 | 21051 | 591 |
| 11 | Installation | Services | 50 | 21101 | 89 |
| 12 | Training | Services | 30 | 21131 | 89 |
| 13 | Maintenance | Services | 9 | 21140 | 89 |
| 14 | Total | 21140 |
Aggregators are an Enterprise feature. Learn more about aggregators.
Formulas
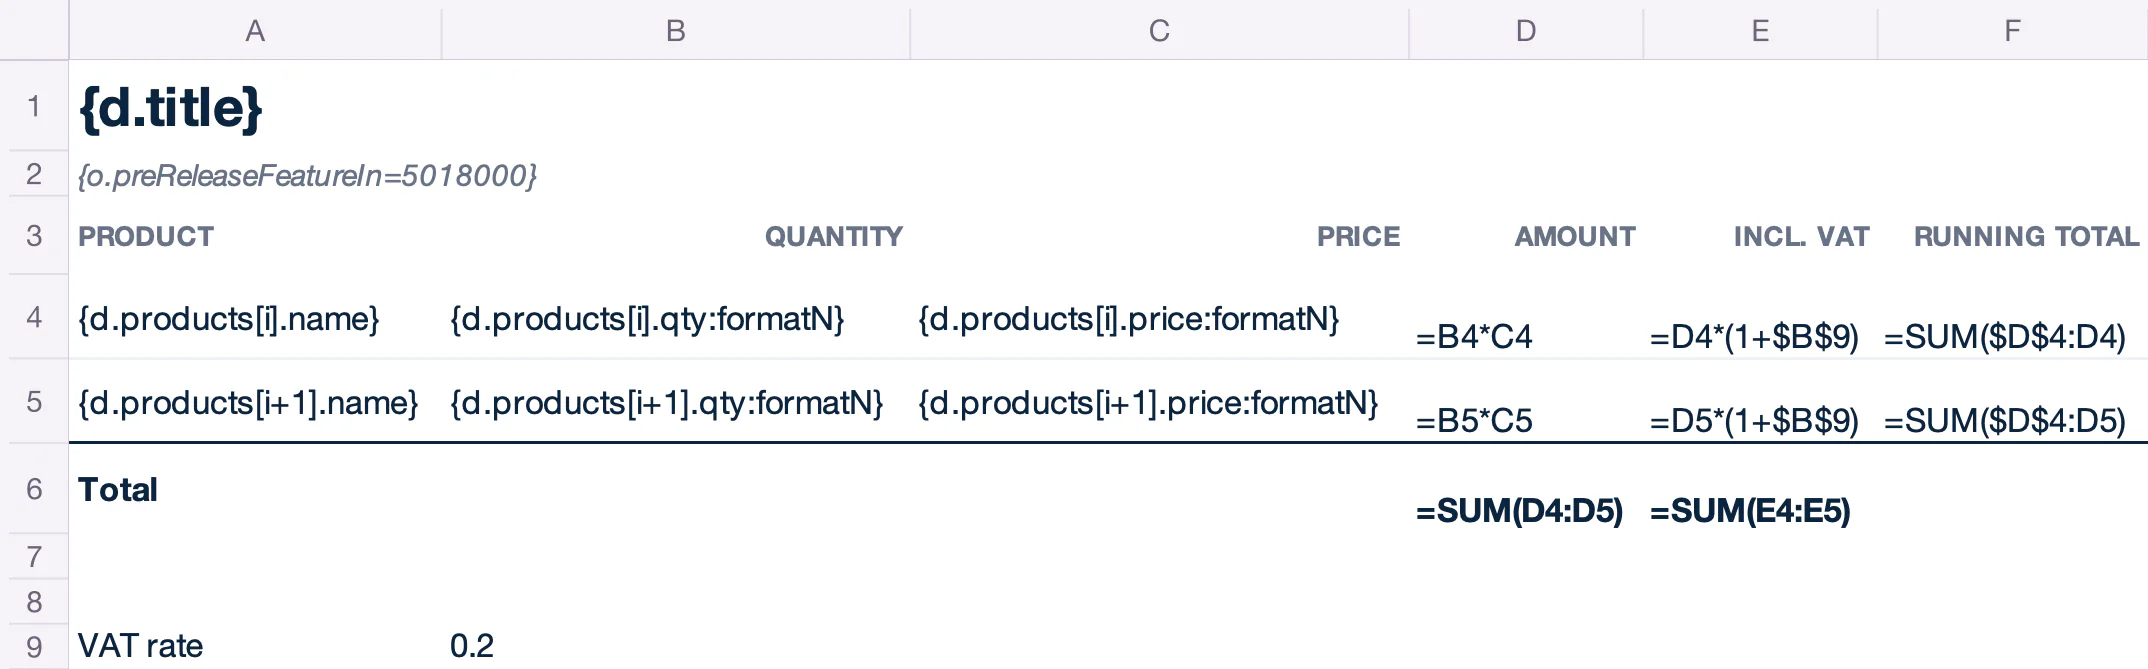
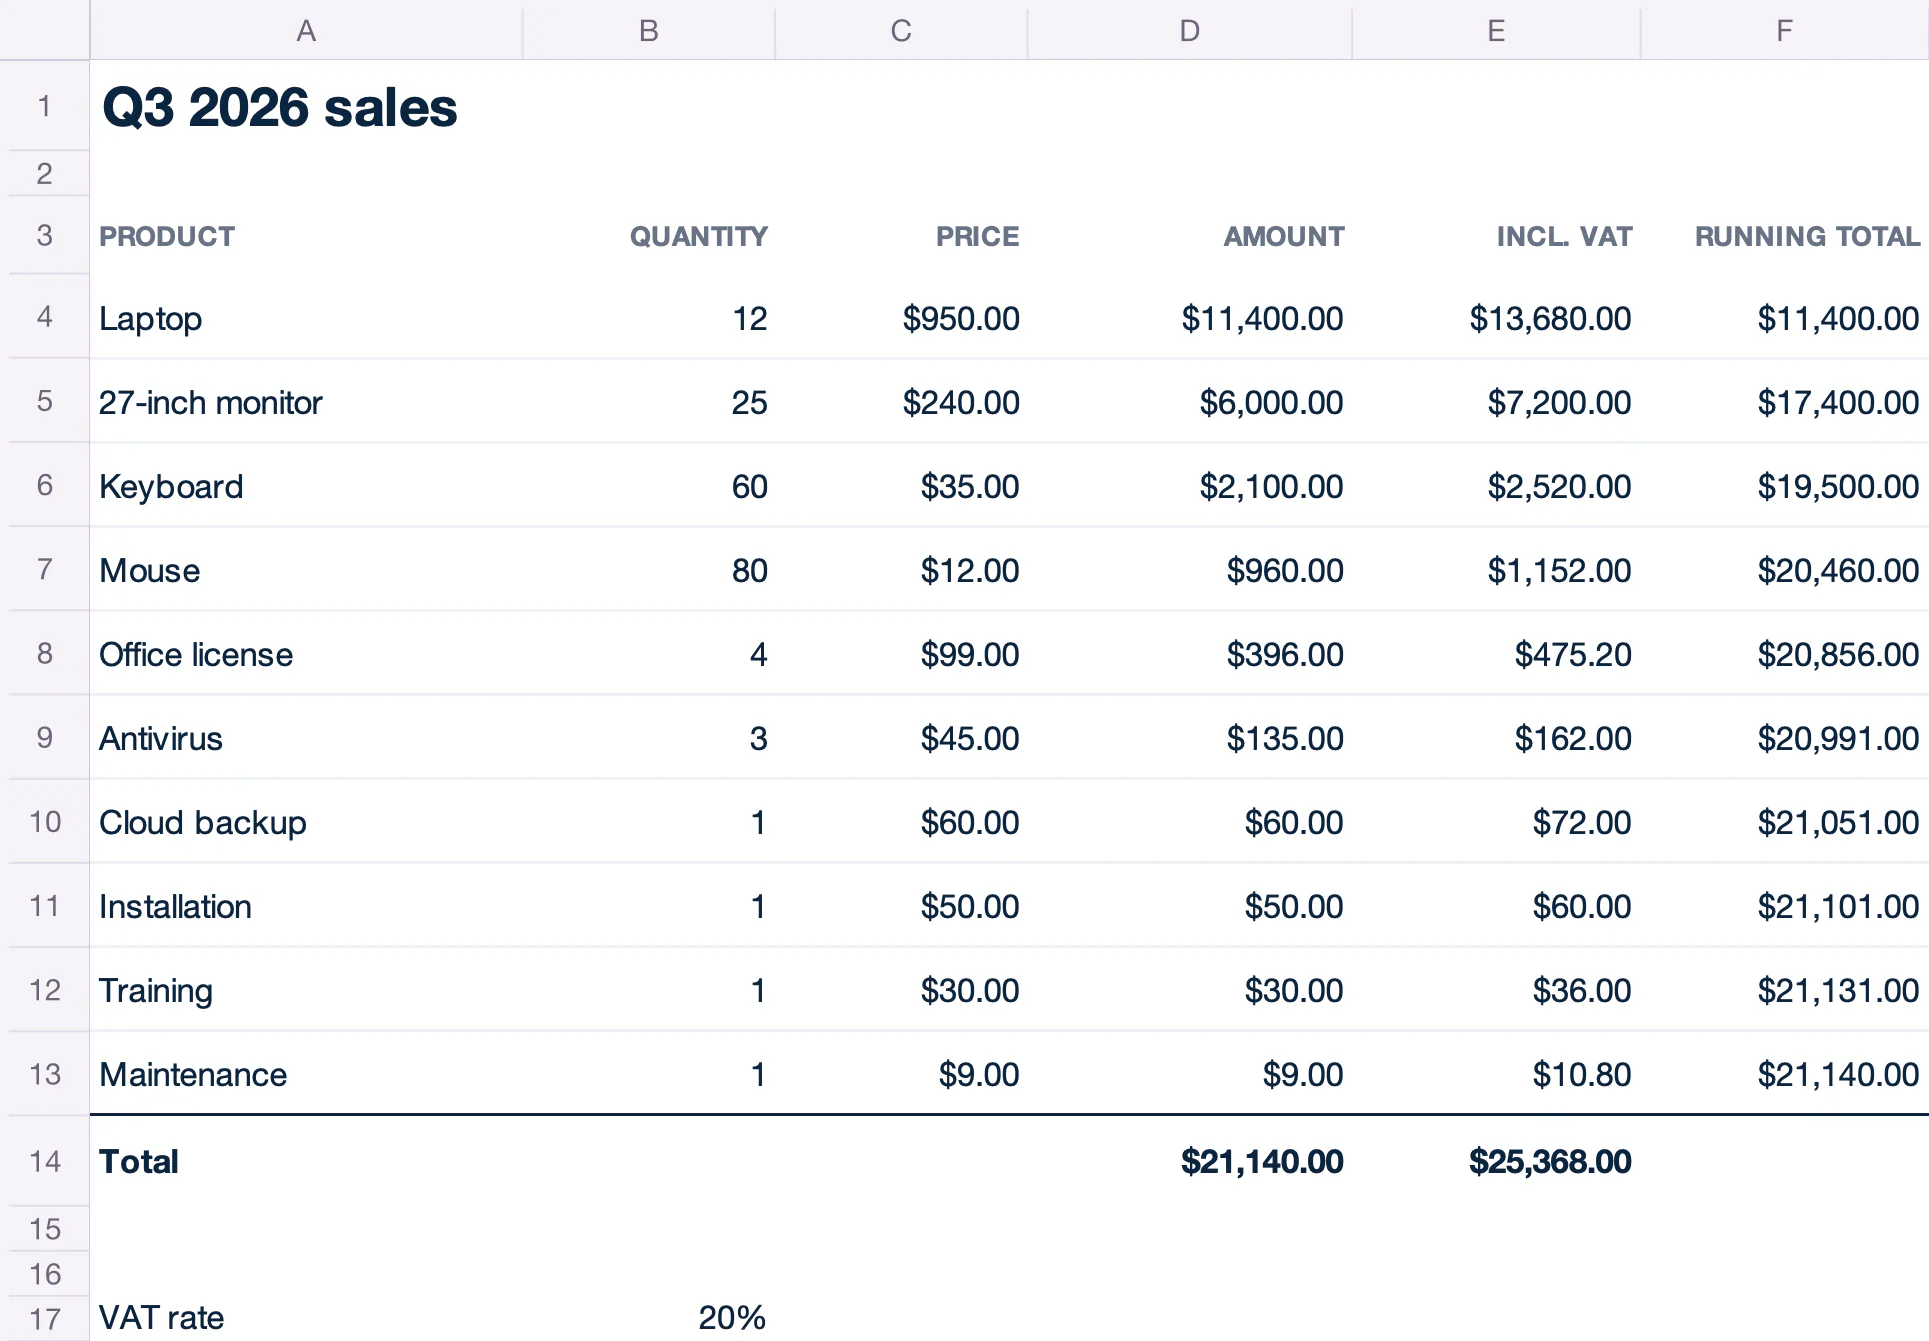
PRE-RELEASE v5.18.0+ Add {o.preReleaseFeatureIn=5018000} to the template. Without it, formulas, merged cells, conditional formatting, data validations, tables, charts, pivot tables, hyperlinks, named ranges, the print area and page breaks do not follow the rows added by loops. Learn more
Carbone updates formulas the way Excel does when you insert rows:
- A formula in the repeated row follows its row:
=B4*C4becomes=B5*C5on the next row. - A total below the loop covers all the generated rows:
=SUM(D4:D5)becomes=SUM(D4:D13). - An absolute reference follows its cell:
$B$9, the VAT rate below the table, becomes$B$17.
Excel recalculates the workbook when you open the file.
{
  "title": "Q3 2026 sales",
  "total": 21140,
  "products": [
    { "name": "Laptop",          "category": "Hardware", "qty": 12, "price": 950, "amount": 11400, "status": "In stock" },
    { "name": "27-inch monitor", "category": "Hardware", "qty": 25, "price": 240, "amount": 6000,  "status": "Out of stock" },
    { "name": "Keyboard",        "category": "Hardware", "qty": 60, "price": 35,  "amount": 2100,  "status": "In stock" },
    { "name": "Mouse",           "category": "Hardware", "qty": 80, "price": 12,  "amount": 960,   "status": "Backorder" },
    { "name": "Office license",  "category": "Software", "qty": 4,  "price": 99,  "amount": 396,   "status": "In stock" },
    { "name": "Antivirus",       "category": "Software", "qty": 3,  "price": 45,  "amount": 135,   "status": "Out of stock" },
    { "name": "Cloud backup",    "category": "Software", "qty": 1,  "price": 60,  "amount": 60,    "status": "In stock" },
    { "name": "Installation",    "category": "Services", "qty": 1,  "price": 50,  "amount": 50,    "status": "Backorder" },
    { "name": "Training",        "category": "Services", "qty": 1,  "price": 30,  "amount": 30,    "status": "In stock" },
    { "name": "Maintenance",     "category": "Services", "qty": 1,  "price": 9,   "amount": 9,     "status": "Out of stock" }
  ]
}
| Row | A | B | C | D | E | F |
|---|---|---|---|---|---|---|
| 1 | {d.title} | |||||
| 2 | {o.preReleaseFeatureIn=5018000} | |||||
| 3 | PRODUCT | QUANTITY | PRICE | AMOUNT | INCL. VAT | RUNNING TOTAL |
| 4 | {d.products[i].name} | {d.products[i].qty:formatN} | {d.products[i].price:formatN} | =B4*C4 | =D4*(1+$B$9) | =SUM($D$4:D4) |
| 5 | {d.products[i+1].name} | {d.products[i+1].qty:formatN} | {d.products[i+1].price:formatN} | =B5*C5 | =D5*(1+$B$9) | =SUM($D$4:D5) |
| 6 | Total | =SUM(D4:D5) | =SUM(E4:E5) | |||
| 9 | VAT rate | 0.2 |
| Row | A | B | C | D | E | F |
|---|---|---|---|---|---|---|
| 1 | Q3 2026 sales | |||||
| 3 | PRODUCT | QUANTITY | PRICE | AMOUNT | INCL. VAT | RUNNING TOTAL |
| 4 | Laptop | 12 | 950 | =B4*C4 | =D4*(1+$B$17) | =SUM($D$4:D4) |
| 5 | 27-inch monitor | 25 | 240 | =B5*C5 | =D5*(1+$B$17) | =SUM($D$4:D5) |
| 6 | Keyboard | 60 | 35 | =B6*C6 | =D6*(1+$B$17) | =SUM($D$4:D6) |
| 7 | Mouse | 80 | 12 | =B7*C7 | =D7*(1+$B$17) | =SUM($D$4:D7) |
| 8 | Office license | 4 | 99 | =B8*C8 | =D8*(1+$B$17) | =SUM($D$4:D8) |
| 9 | Antivirus | 3 | 45 | =B9*C9 | =D9*(1+$B$17) | =SUM($D$4:D9) |
| 10 | Cloud backup | 1 | 60 | =B10*C10 | =D10*(1+$B$17) | =SUM($D$4:D10) |
| 11 | Installation | 1 | 50 | =B11*C11 | =D11*(1+$B$17) | =SUM($D$4:D11) |
| 12 | Training | 1 | 30 | =B12*C12 | =D12*(1+$B$17) | =SUM($D$4:D12) |
| 13 | Maintenance | 1 | 9 | =B13*C13 | =D13*(1+$B$17) | =SUM($D$4:D13) |
| 14 | Total | =SUM(D4:D13) | =SUM(E4:E13) | |||
| 17 | VAT rate | 0.2 |
Named ranges cover the generated rows too. Carbone does not change formulas that contain Carbone tags or use INDIRECT.
Merged cells
PRE-RELEASE v5.18.0+ Add {o.preReleaseFeatureIn=5018000} to the template. A sheet that uses :mergeCell gets this feature without the tag.
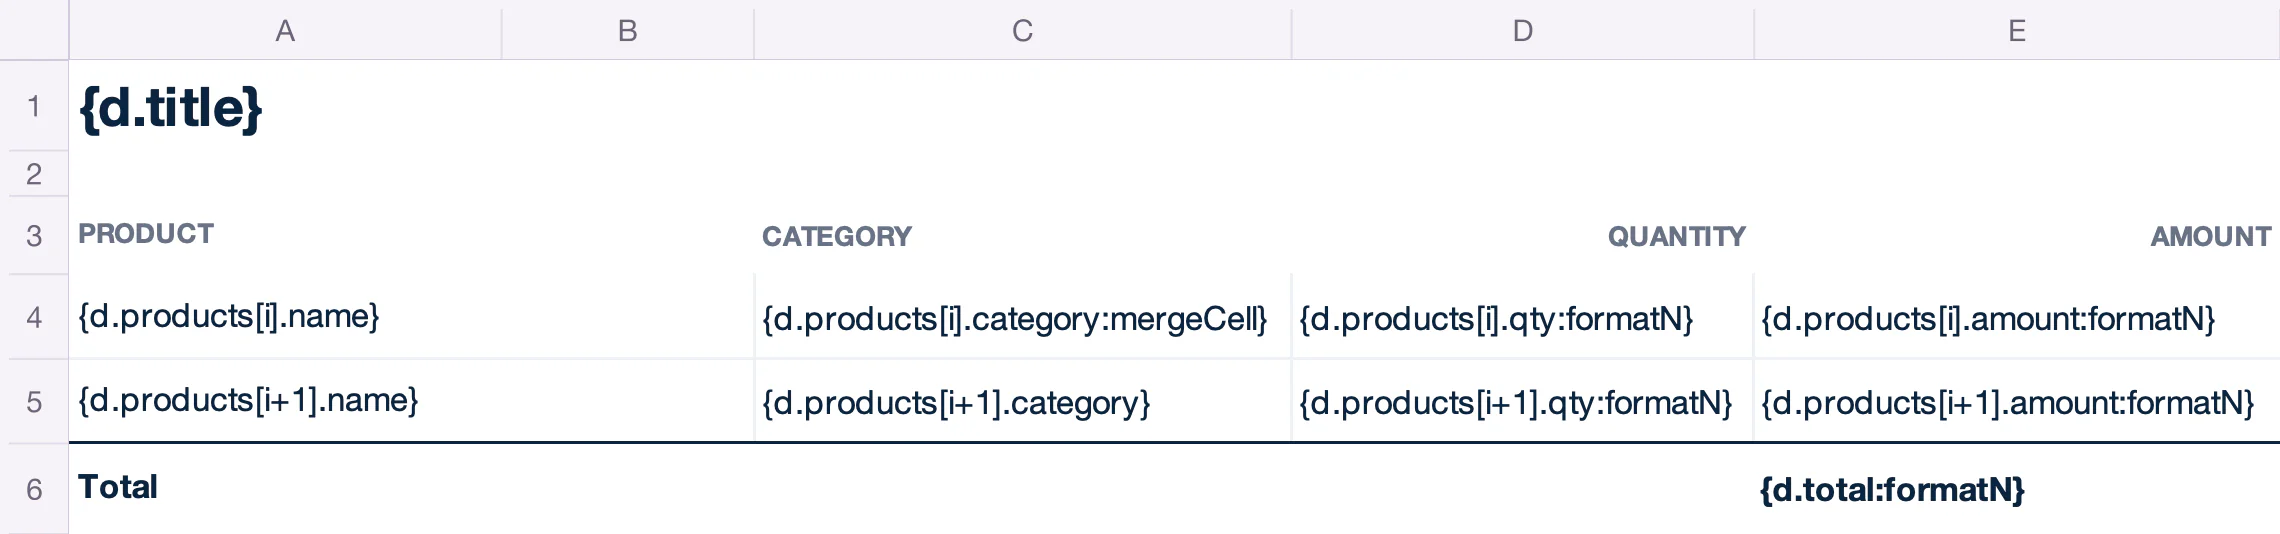
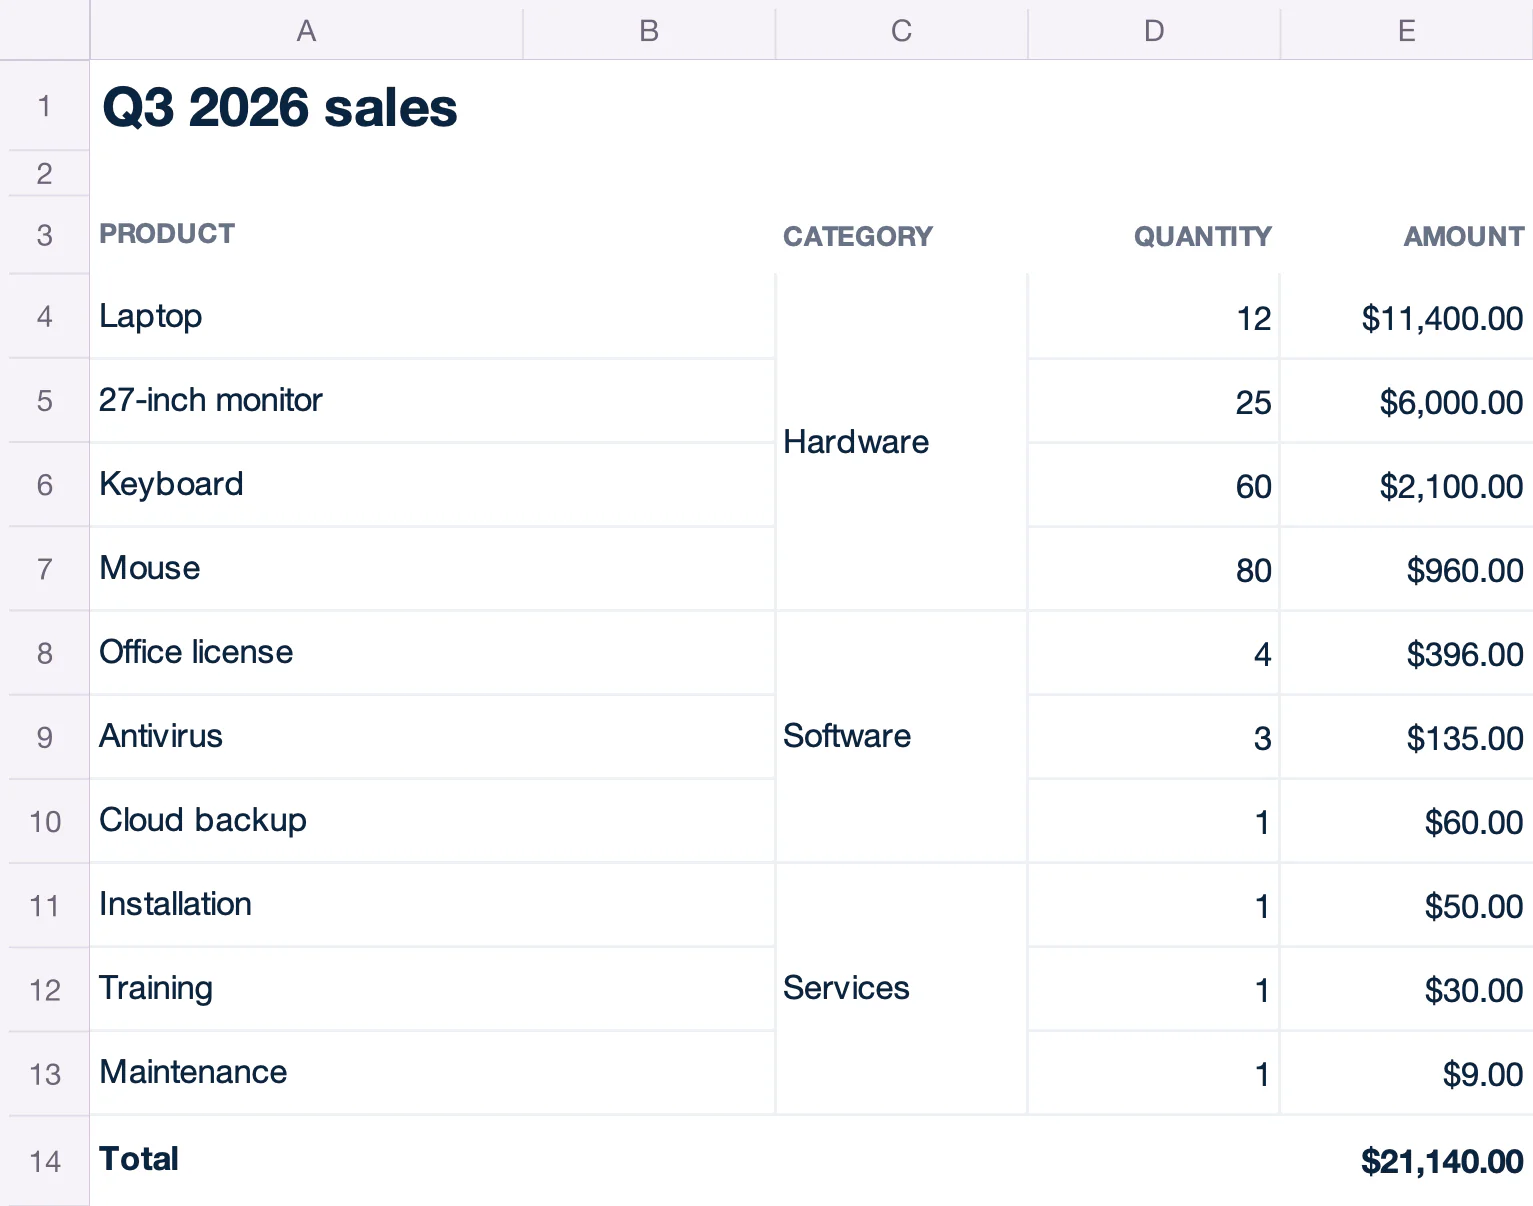
Merged cells in the repeated row are copied to each row, like the product in columns A and B. Merged cells below the loop move down, like the total.
:mergeCell merges the consecutive cells of a column that have the same value. {d.products[i].category:mergeCell} prints each category once, in one cell merged over its products.
{
  "title": "Q3 2026 sales",
  "total": 21140,
  "products": [
    { "name": "Laptop",          "category": "Hardware", "qty": 12, "price": 950, "amount": 11400, "status": "In stock" },
    { "name": "27-inch monitor", "category": "Hardware", "qty": 25, "price": 240, "amount": 6000,  "status": "Out of stock" },
    { "name": "Keyboard",        "category": "Hardware", "qty": 60, "price": 35,  "amount": 2100,  "status": "In stock" },
    { "name": "Mouse",           "category": "Hardware", "qty": 80, "price": 12,  "amount": 960,   "status": "Backorder" },
    { "name": "Office license",  "category": "Software", "qty": 4,  "price": 99,  "amount": 396,   "status": "In stock" },
    { "name": "Antivirus",       "category": "Software", "qty": 3,  "price": 45,  "amount": 135,   "status": "Out of stock" },
    { "name": "Cloud backup",    "category": "Software", "qty": 1,  "price": 60,  "amount": 60,    "status": "In stock" },
    { "name": "Installation",    "category": "Services", "qty": 1,  "price": 50,  "amount": 50,    "status": "Backorder" },
    { "name": "Training",        "category": "Services", "qty": 1,  "price": 30,  "amount": 30,    "status": "In stock" },
    { "name": "Maintenance",     "category": "Services", "qty": 1,  "price": 9,   "amount": 9,     "status": "Out of stock" }
  ]
}
| Row | A | B | C | D | E |
|---|---|---|---|---|---|
| 1 | {d.title} | ||||
| 3 | PRODUCT | CATEGORY | QUANTITY | AMOUNT | |
| 4 | {d.products[i].name} | {d.products[i].category:mergeCell} | {d.products[i].qty:formatN} | {d.products[i].amount:formatN} | |
| 5 | {d.products[i+1].name} | {d.products[i+1].category} | {d.products[i+1].qty:formatN} | {d.products[i+1].amount:formatN} | |
| 6 | Total | {d.total:formatN} |
| Row | A | B | C | D | E |
|---|---|---|---|---|---|
| 1 | Q3 2026 sales | ||||
| 3 | PRODUCT | CATEGORY | QUANTITY | AMOUNT | |
| 4 | Laptop | Hardware | 12 | 11400 | |
| 5 | 27-inch monitor | 25 | 6000 | ||
| 6 | Keyboard | 60 | 2100 | ||
| 7 | Mouse | 80 | 960 | ||
| 8 | Office license | Software | 4 | 396 | |
| 9 | Antivirus | 3 | 135 | ||
| 10 | Cloud backup | 1 | 60 | ||
| 11 | Installation | Services | 1 | 50 | |
| 12 | Training | 1 | 30 | ||
| 13 | Maintenance | 1 | 9 | ||
| 14 | Total | 21140 |
- Pass a parent to merge only within a group.
{d.products[i].status:mergeCell(.category)}merges identical statuses within the same category. You can pass several parents::mergeCell(.country, .region). :mergeCellmust be the last formatter of the tag.- A cell merged horizontally in the template keeps its width and grows down.
- Available in XLSX templates only for now. The rows must be consecutive, so a loop that repeats two rows per item is not merged.
Conditional formatting
PRE-RELEASE v5.18.0+ Add {o.preReleaseFeatureIn=5018000} to the template.
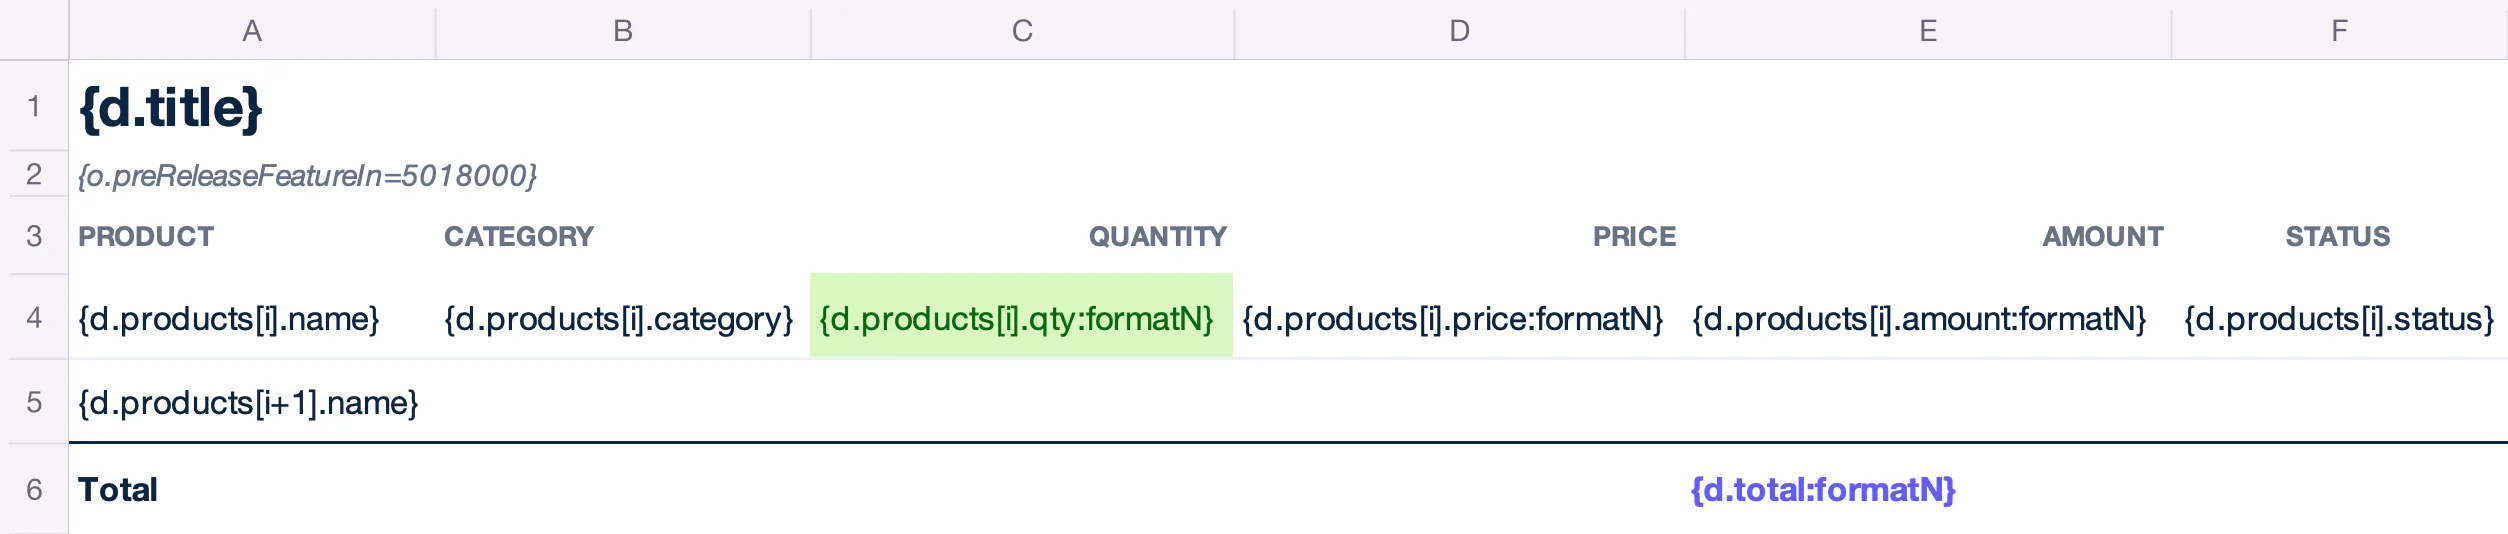
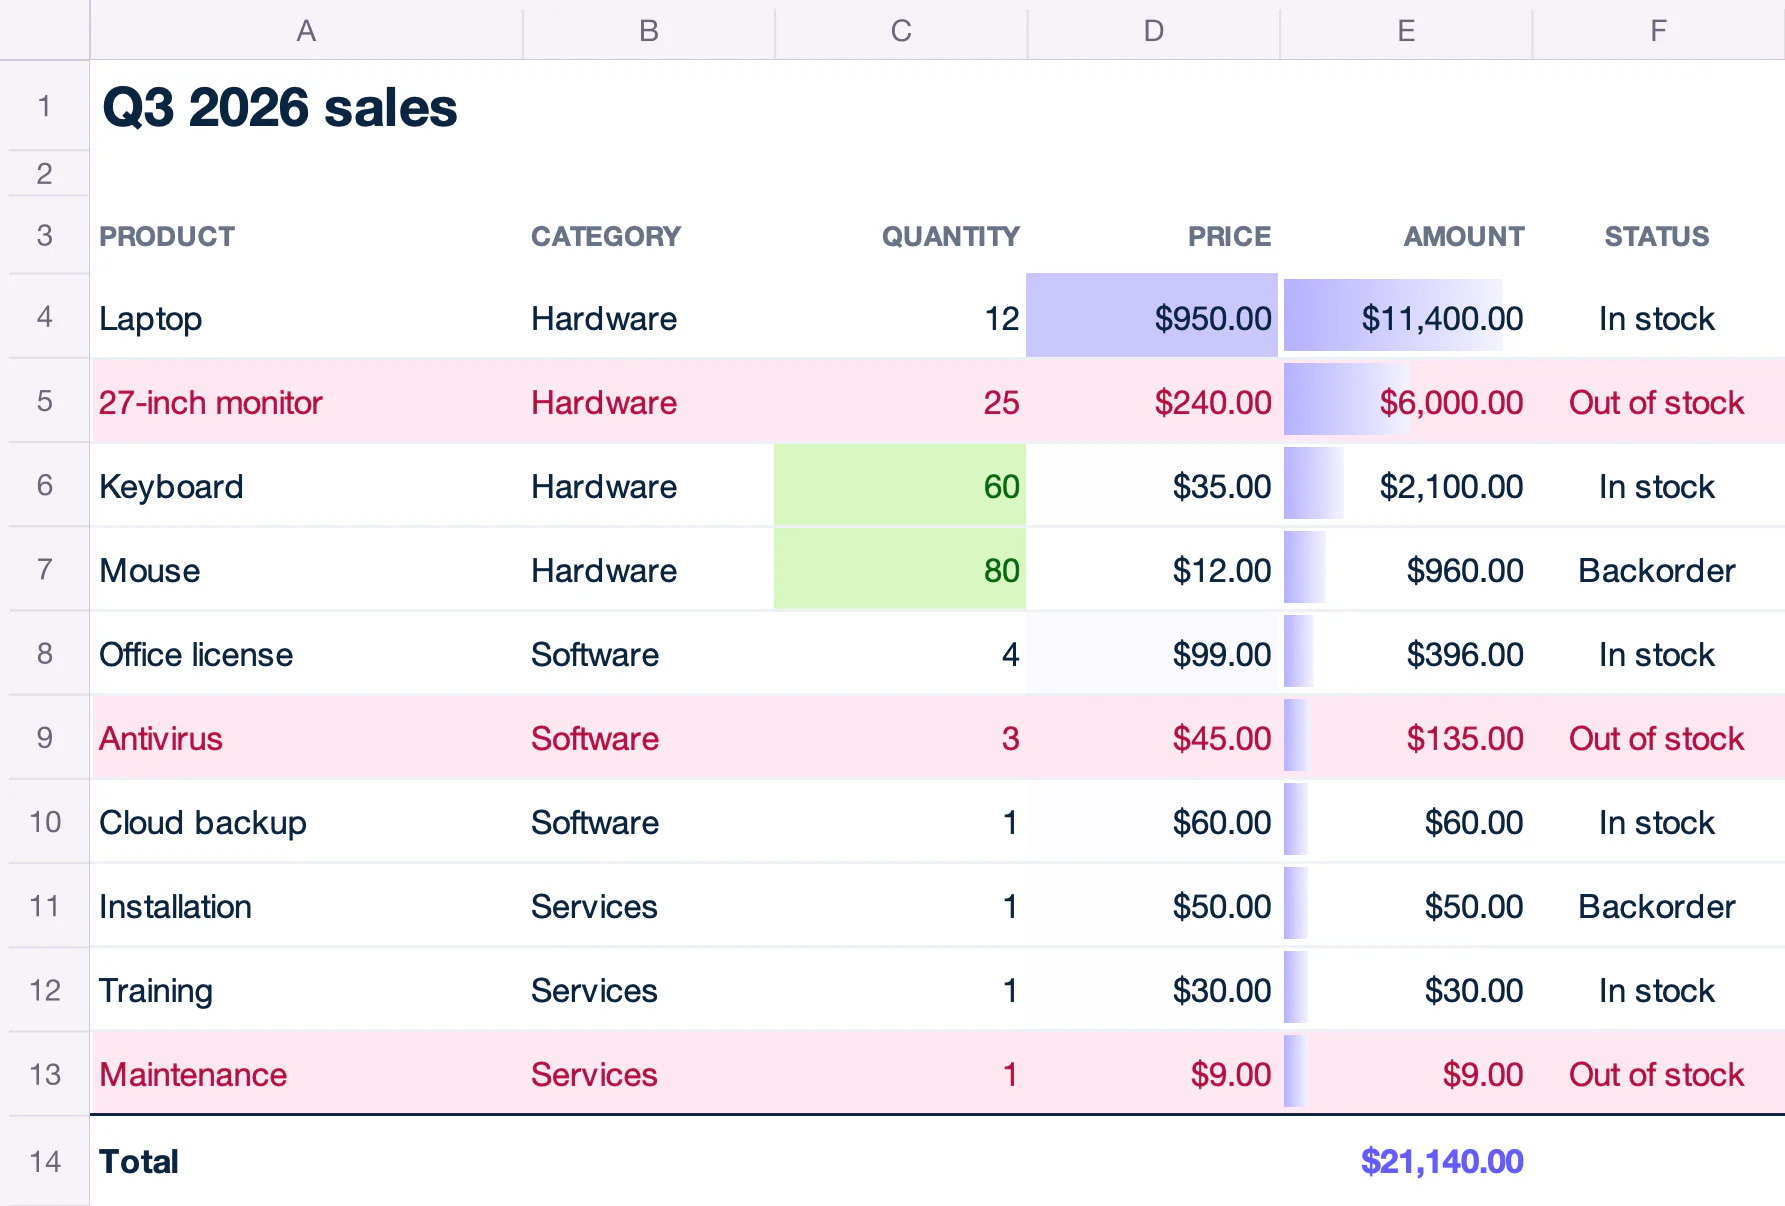
Define the rules on the repeated row, and Carbone extends them to every generated row. In this example, quantities above 50 are green, a formula rule highlights out-of-stock products, prices get a color scale, and amounts get data bars. The rule on the total moves with the total.
{
  "title": "Q3 2026 sales",
  "total": 21140,
  "products": [
    { "name": "Laptop",          "category": "Hardware", "qty": 12, "price": 950, "amount": 11400, "status": "In stock" },
    { "name": "27-inch monitor", "category": "Hardware", "qty": 25, "price": 240, "amount": 6000,  "status": "Out of stock" },
    { "name": "Keyboard",        "category": "Hardware", "qty": 60, "price": 35,  "amount": 2100,  "status": "In stock" },
    { "name": "Mouse",           "category": "Hardware", "qty": 80, "price": 12,  "amount": 960,   "status": "Backorder" },
    { "name": "Office license",  "category": "Software", "qty": 4,  "price": 99,  "amount": 396,   "status": "In stock" },
    { "name": "Antivirus",       "category": "Software", "qty": 3,  "price": 45,  "amount": 135,   "status": "Out of stock" },
    { "name": "Cloud backup",    "category": "Software", "qty": 1,  "price": 60,  "amount": 60,    "status": "In stock" },
    { "name": "Installation",    "category": "Services", "qty": 1,  "price": 50,  "amount": 50,    "status": "Backorder" },
    { "name": "Training",        "category": "Services", "qty": 1,  "price": 30,  "amount": 30,    "status": "In stock" },
    { "name": "Maintenance",     "category": "Services", "qty": 1,  "price": 9,   "amount": 9,     "status": "Out of stock" }
  ]
}
| Row | A | B | C | D | E | F |
|---|---|---|---|---|---|---|
| 1 | {d.title} | |||||
| 2 | {o.preReleaseFeatureIn=5018000} | |||||
| 3 | PRODUCT | CATEGORY | QUANTITY | PRICE | AMOUNT | STATUS |
| 4 | {d.products[i].name} | {d.products[i].category} | {d.products[i].qty:formatN} | {d.products[i].price:formatN} | {d.products[i].amount:formatN} | {d.products[i].status} |
| 5 | {d.products[i+1].name} | |||||
| 6 | Total | {d.total:formatN} |
| Row | A | B | C | D | E | F |
|---|---|---|---|---|---|---|
| 1 | Q3 2026 sales | |||||
| 3 | PRODUCT | CATEGORY | QUANTITY | PRICE | AMOUNT | STATUS |
| 4 | Laptop | Hardware | 12 | 950 | 11400 | In stock |
| 5 | 27-inch monitor | Hardware | 25 | 240 | 6000 | Out of stock |
| 6 | Keyboard | Hardware | 60 | 35 | 2100 | In stock |
| 7 | Mouse | Hardware | 80 | 12 | 960 | Backorder |
| 8 | Office license | Software | 4 | 99 | 396 | In stock |
| 9 | Antivirus | Software | 3 | 45 | 135 | Out of stock |
| 10 | Cloud backup | Software | 1 | 60 | 60 | In stock |
| 11 | Installation | Services | 1 | 50 | 50 | Backorder |
| 12 | Training | Services | 1 | 30 | 30 | In stock |
| 13 | Maintenance | Services | 1 | 9 | 9 | Out of stock |
| 14 | Total | 21140 |
Tables and filters
PRE-RELEASE v5.18.0+ Add {o.preReleaseFeatureIn=5018000} to the template.
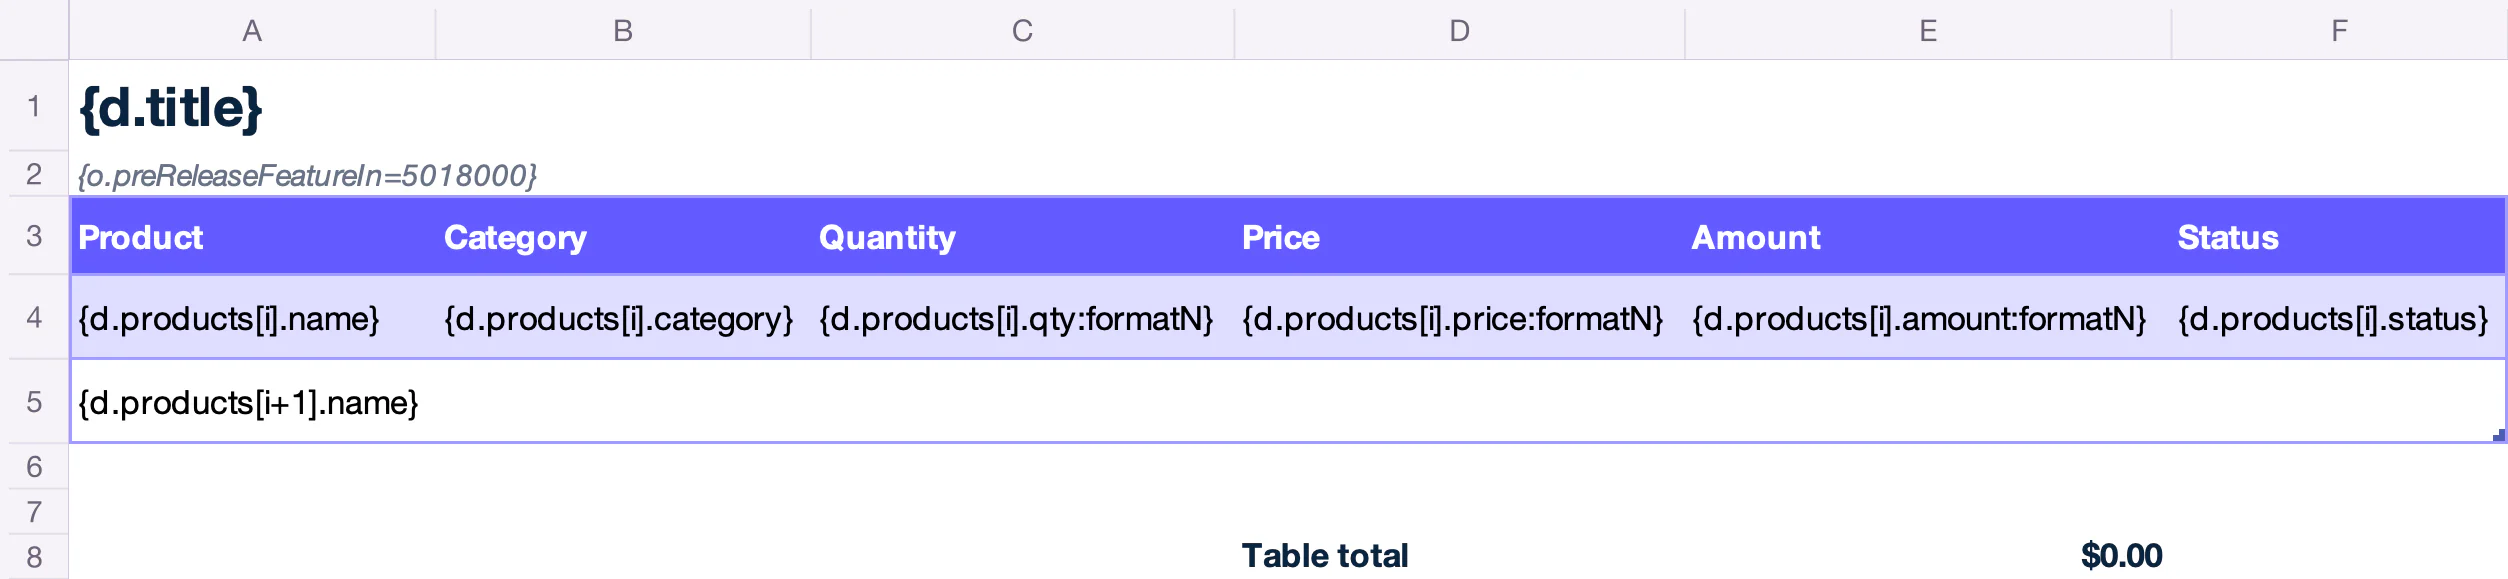
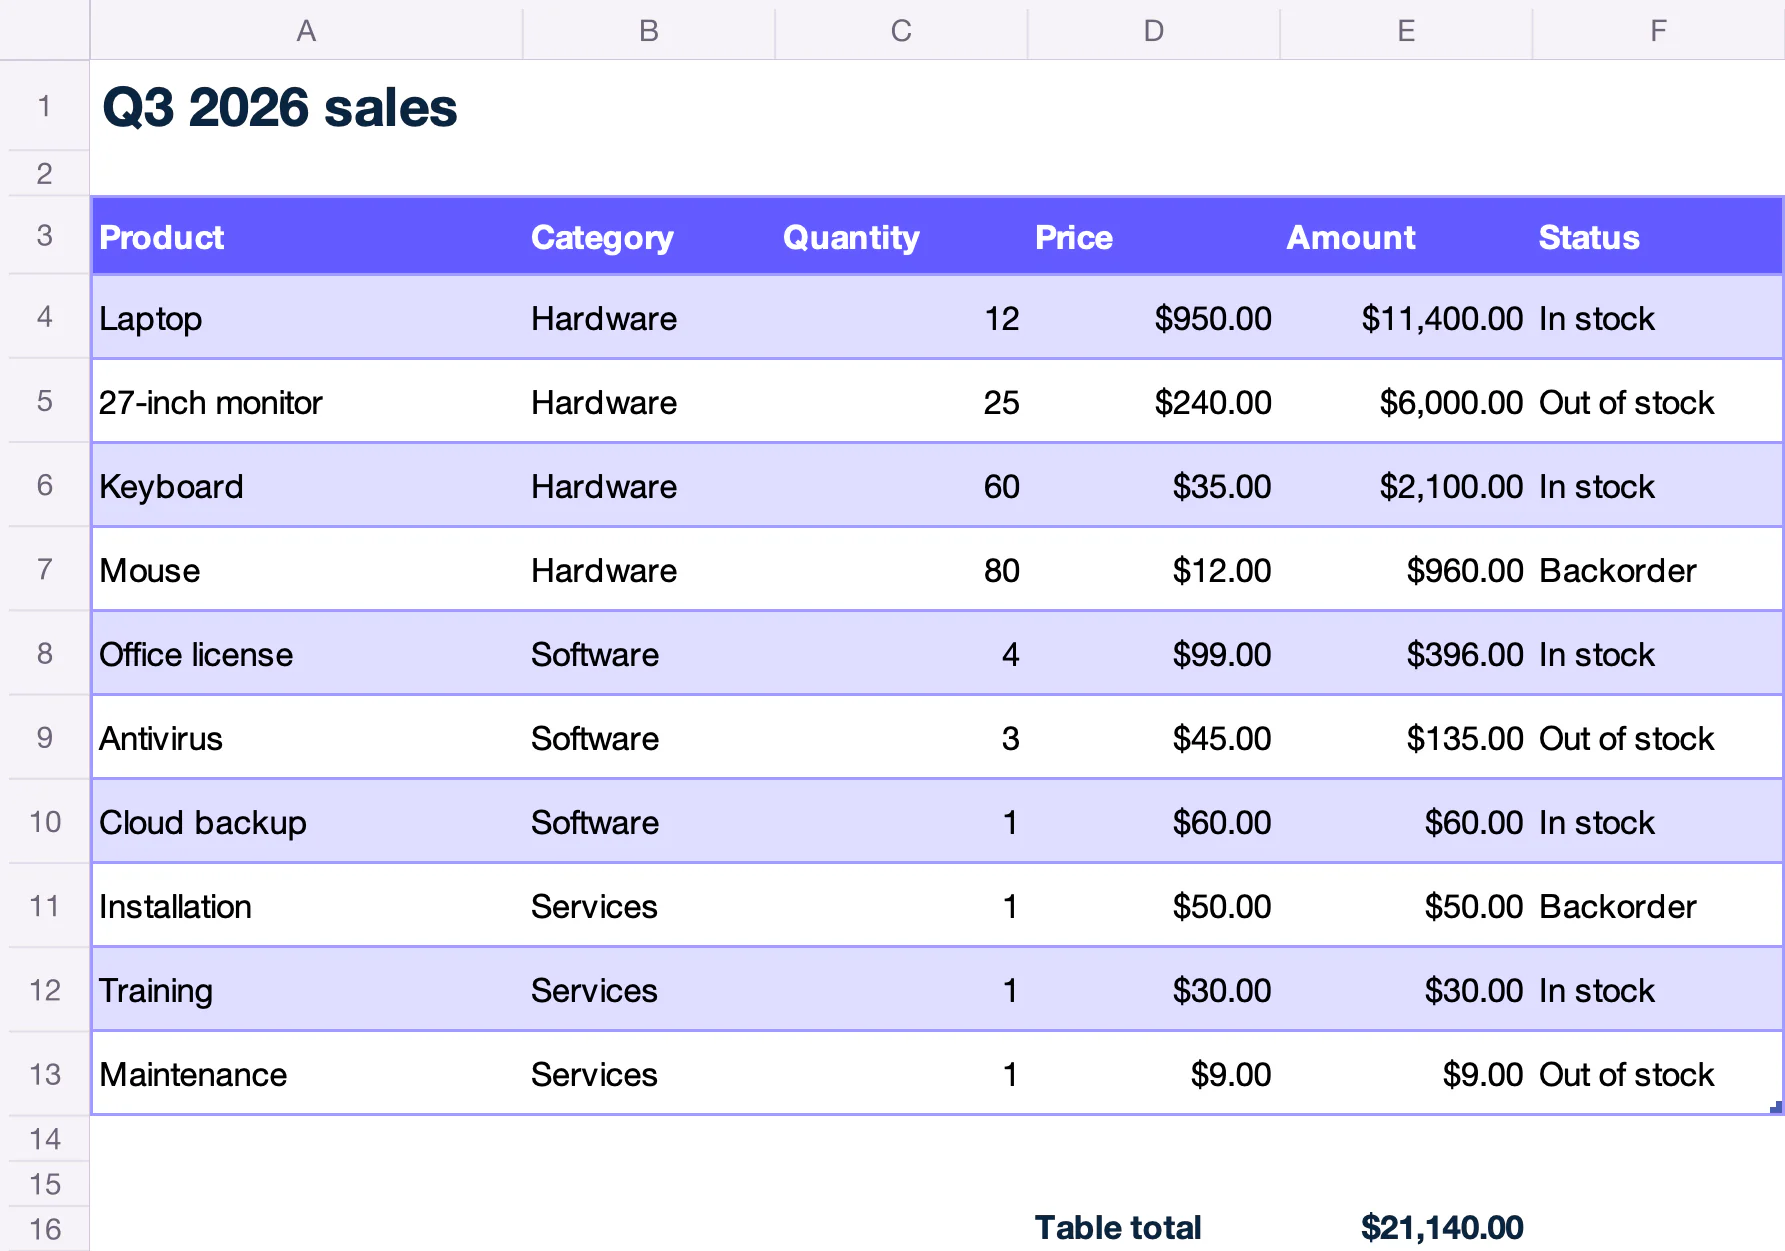
An Excel table (Insert > Table) on the loop grows with the data. Banded rows, filter buttons and structured references like =SUM(Sales[Amount]) cover all the generated rows.
{
  "title": "Q3 2026 sales",
  "total": 21140,
  "products": [
    { "name": "Laptop",          "category": "Hardware", "qty": 12, "price": 950, "amount": 11400, "status": "In stock" },
    { "name": "27-inch monitor", "category": "Hardware", "qty": 25, "price": 240, "amount": 6000,  "status": "Out of stock" },
    { "name": "Keyboard",        "category": "Hardware", "qty": 60, "price": 35,  "amount": 2100,  "status": "In stock" },
    { "name": "Mouse",           "category": "Hardware", "qty": 80, "price": 12,  "amount": 960,   "status": "Backorder" },
    { "name": "Office license",  "category": "Software", "qty": 4,  "price": 99,  "amount": 396,   "status": "In stock" },
    { "name": "Antivirus",       "category": "Software", "qty": 3,  "price": 45,  "amount": 135,   "status": "Out of stock" },
    { "name": "Cloud backup",    "category": "Software", "qty": 1,  "price": 60,  "amount": 60,    "status": "In stock" },
    { "name": "Installation",    "category": "Services", "qty": 1,  "price": 50,  "amount": 50,    "status": "Backorder" },
    { "name": "Training",        "category": "Services", "qty": 1,  "price": 30,  "amount": 30,    "status": "In stock" },
    { "name": "Maintenance",     "category": "Services", "qty": 1,  "price": 9,   "amount": 9,     "status": "Out of stock" }
  ]
}
| Row | A | B | C | D | E | F |
|---|---|---|---|---|---|---|
| 1 | {d.title} | |||||
| 2 | {o.preReleaseFeatureIn=5018000} | |||||
| 3 | Product | Category | Quantity | Price | Amount | Status |
| 4 | {d.products[i].name} | {d.products[i].category} | {d.products[i].qty:formatN} | {d.products[i].price:formatN} | {d.products[i].amount:formatN} | {d.products[i].status} |
| 5 | {d.products[i+1].name} | |||||
| 8 | Table total | =SUM(Sales[Amount]) |
| Row | A | B | C | D | E | F |
|---|---|---|---|---|---|---|
| 1 | Q3 2026 sales | |||||
| 3 | Product | Category | Quantity | Price | Amount | Status |
| 4 | Laptop | Hardware | 12 | 950 | 11400 | In stock |
| 5 | 27-inch monitor | Hardware | 25 | 240 | 6000 | Out of stock |
| 6 | Keyboard | Hardware | 60 | 35 | 2100 | In stock |
| 7 | Mouse | Hardware | 80 | 12 | 960 | Backorder |
| 8 | Office license | Software | 4 | 99 | 396 | In stock |
| 9 | Antivirus | Software | 3 | 45 | 135 | Out of stock |
| 10 | Cloud backup | Software | 1 | 60 | 60 | In stock |
| 11 | Installation | Services | 1 | 50 | 50 | Backorder |
| 12 | Training | Services | 1 | 30 | 30 | In stock |
| 13 | Maintenance | Services | 1 | 9 | 9 | Out of stock |
| 16 | Table total | =SUM(Sales[Amount]) |
AutoFilters and data validation rules (drop-down lists, whole numbers...) on the repeated row extend the same way. When the source of a drop-down list is below the loop, the list follows the source cells as they move down.
Charts
PRE-RELEASE v5.18.0+ Add {o.preReleaseFeatureIn=5018000} to the template.
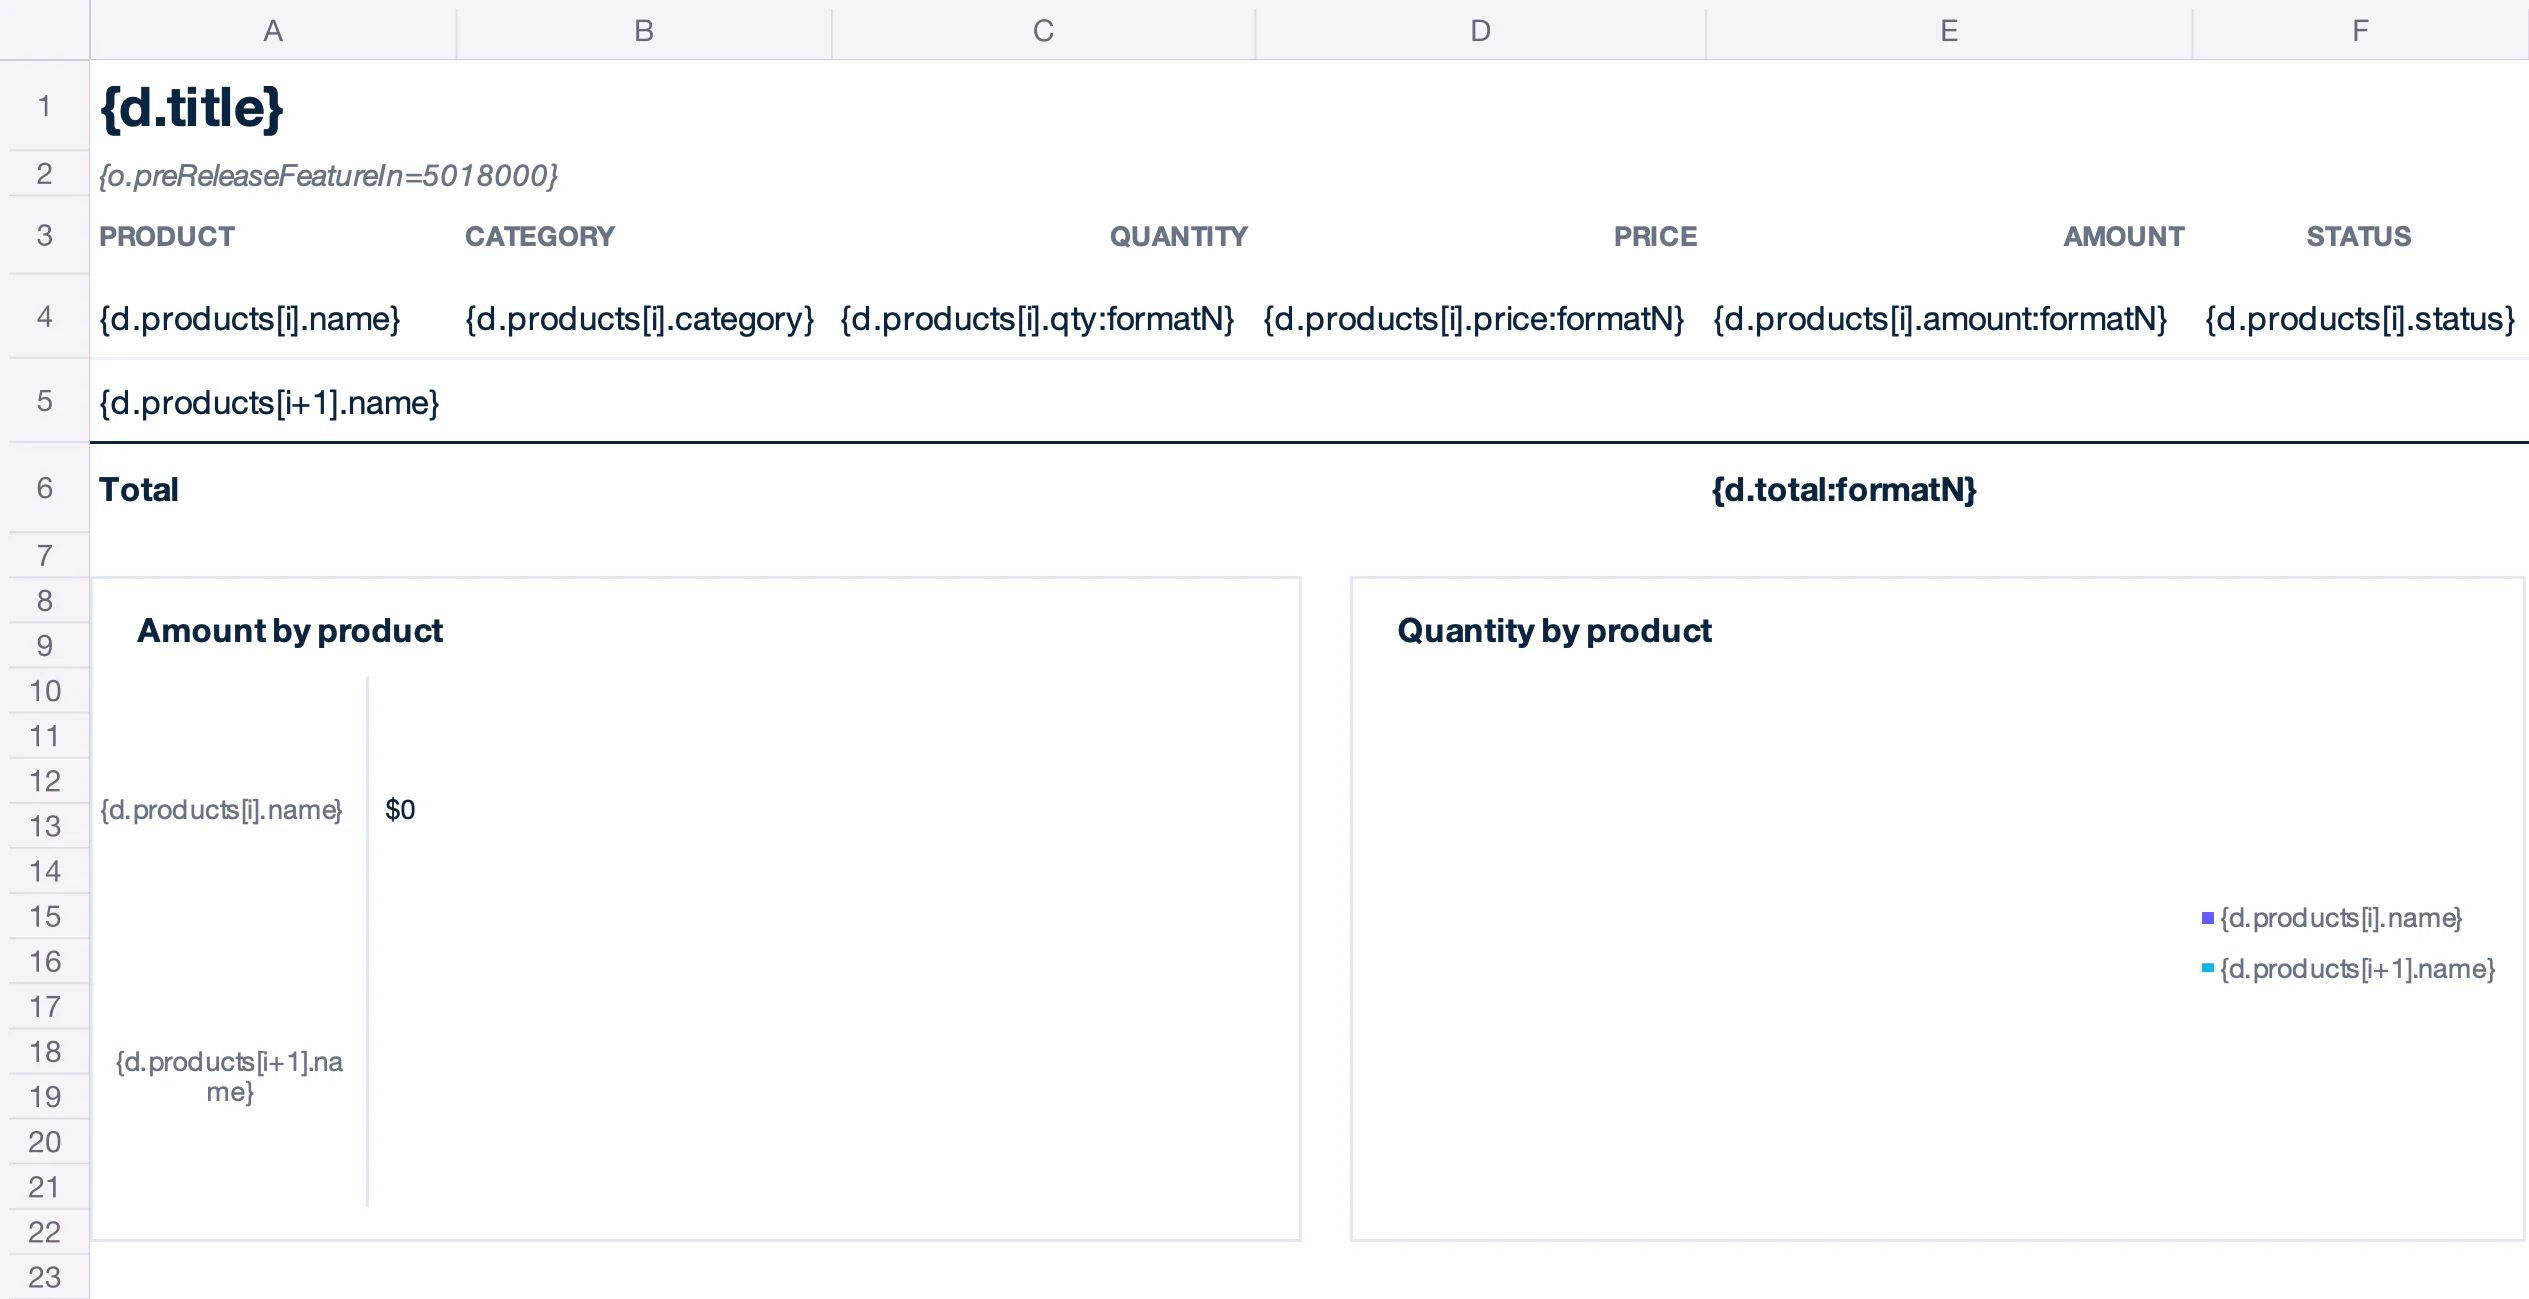
A native Excel chart whose series use the cells of the loop shows all the generated rows. A chart placed below the loop moves down with the rows.
{
  "title": "Q3 2026 sales",
  "total": 21140,
  "products": [
    { "name": "Laptop",          "category": "Hardware", "qty": 12, "price": 950, "amount": 11400, "status": "In stock" },
    { "name": "27-inch monitor", "category": "Hardware", "qty": 25, "price": 240, "amount": 6000,  "status": "Out of stock" },
    { "name": "Keyboard",        "category": "Hardware", "qty": 60, "price": 35,  "amount": 2100,  "status": "In stock" },
    { "name": "Mouse",           "category": "Hardware", "qty": 80, "price": 12,  "amount": 960,   "status": "Backorder" },
    { "name": "Office license",  "category": "Software", "qty": 4,  "price": 99,  "amount": 396,   "status": "In stock" },
    { "name": "Antivirus",       "category": "Software", "qty": 3,  "price": 45,  "amount": 135,   "status": "Out of stock" },
    { "name": "Cloud backup",    "category": "Software", "qty": 1,  "price": 60,  "amount": 60,    "status": "In stock" },
    { "name": "Installation",    "category": "Services", "qty": 1,  "price": 50,  "amount": 50,    "status": "Backorder" },
    { "name": "Training",        "category": "Services", "qty": 1,  "price": 30,  "amount": 30,    "status": "In stock" },
    { "name": "Maintenance",     "category": "Services", "qty": 1,  "price": 9,   "amount": 9,     "status": "Out of stock" }
  ]
}
| Row | A | B | C | D | E | F |
|---|---|---|---|---|---|---|
| 1 | {d.title} | |||||
| 2 | {o.preReleaseFeatureIn=5018000} | |||||
| 3 | PRODUCT | CATEGORY | QUANTITY | PRICE | AMOUNT | STATUS |
| 4 | {d.products[i].name} | {d.products[i].category} | {d.products[i].qty:formatN} | {d.products[i].price:formatN} | {d.products[i].amount:formatN} | {d.products[i].status} |
| 5 | {d.products[i+1].name} | |||||
| 6 | Total | {d.total:formatN} |
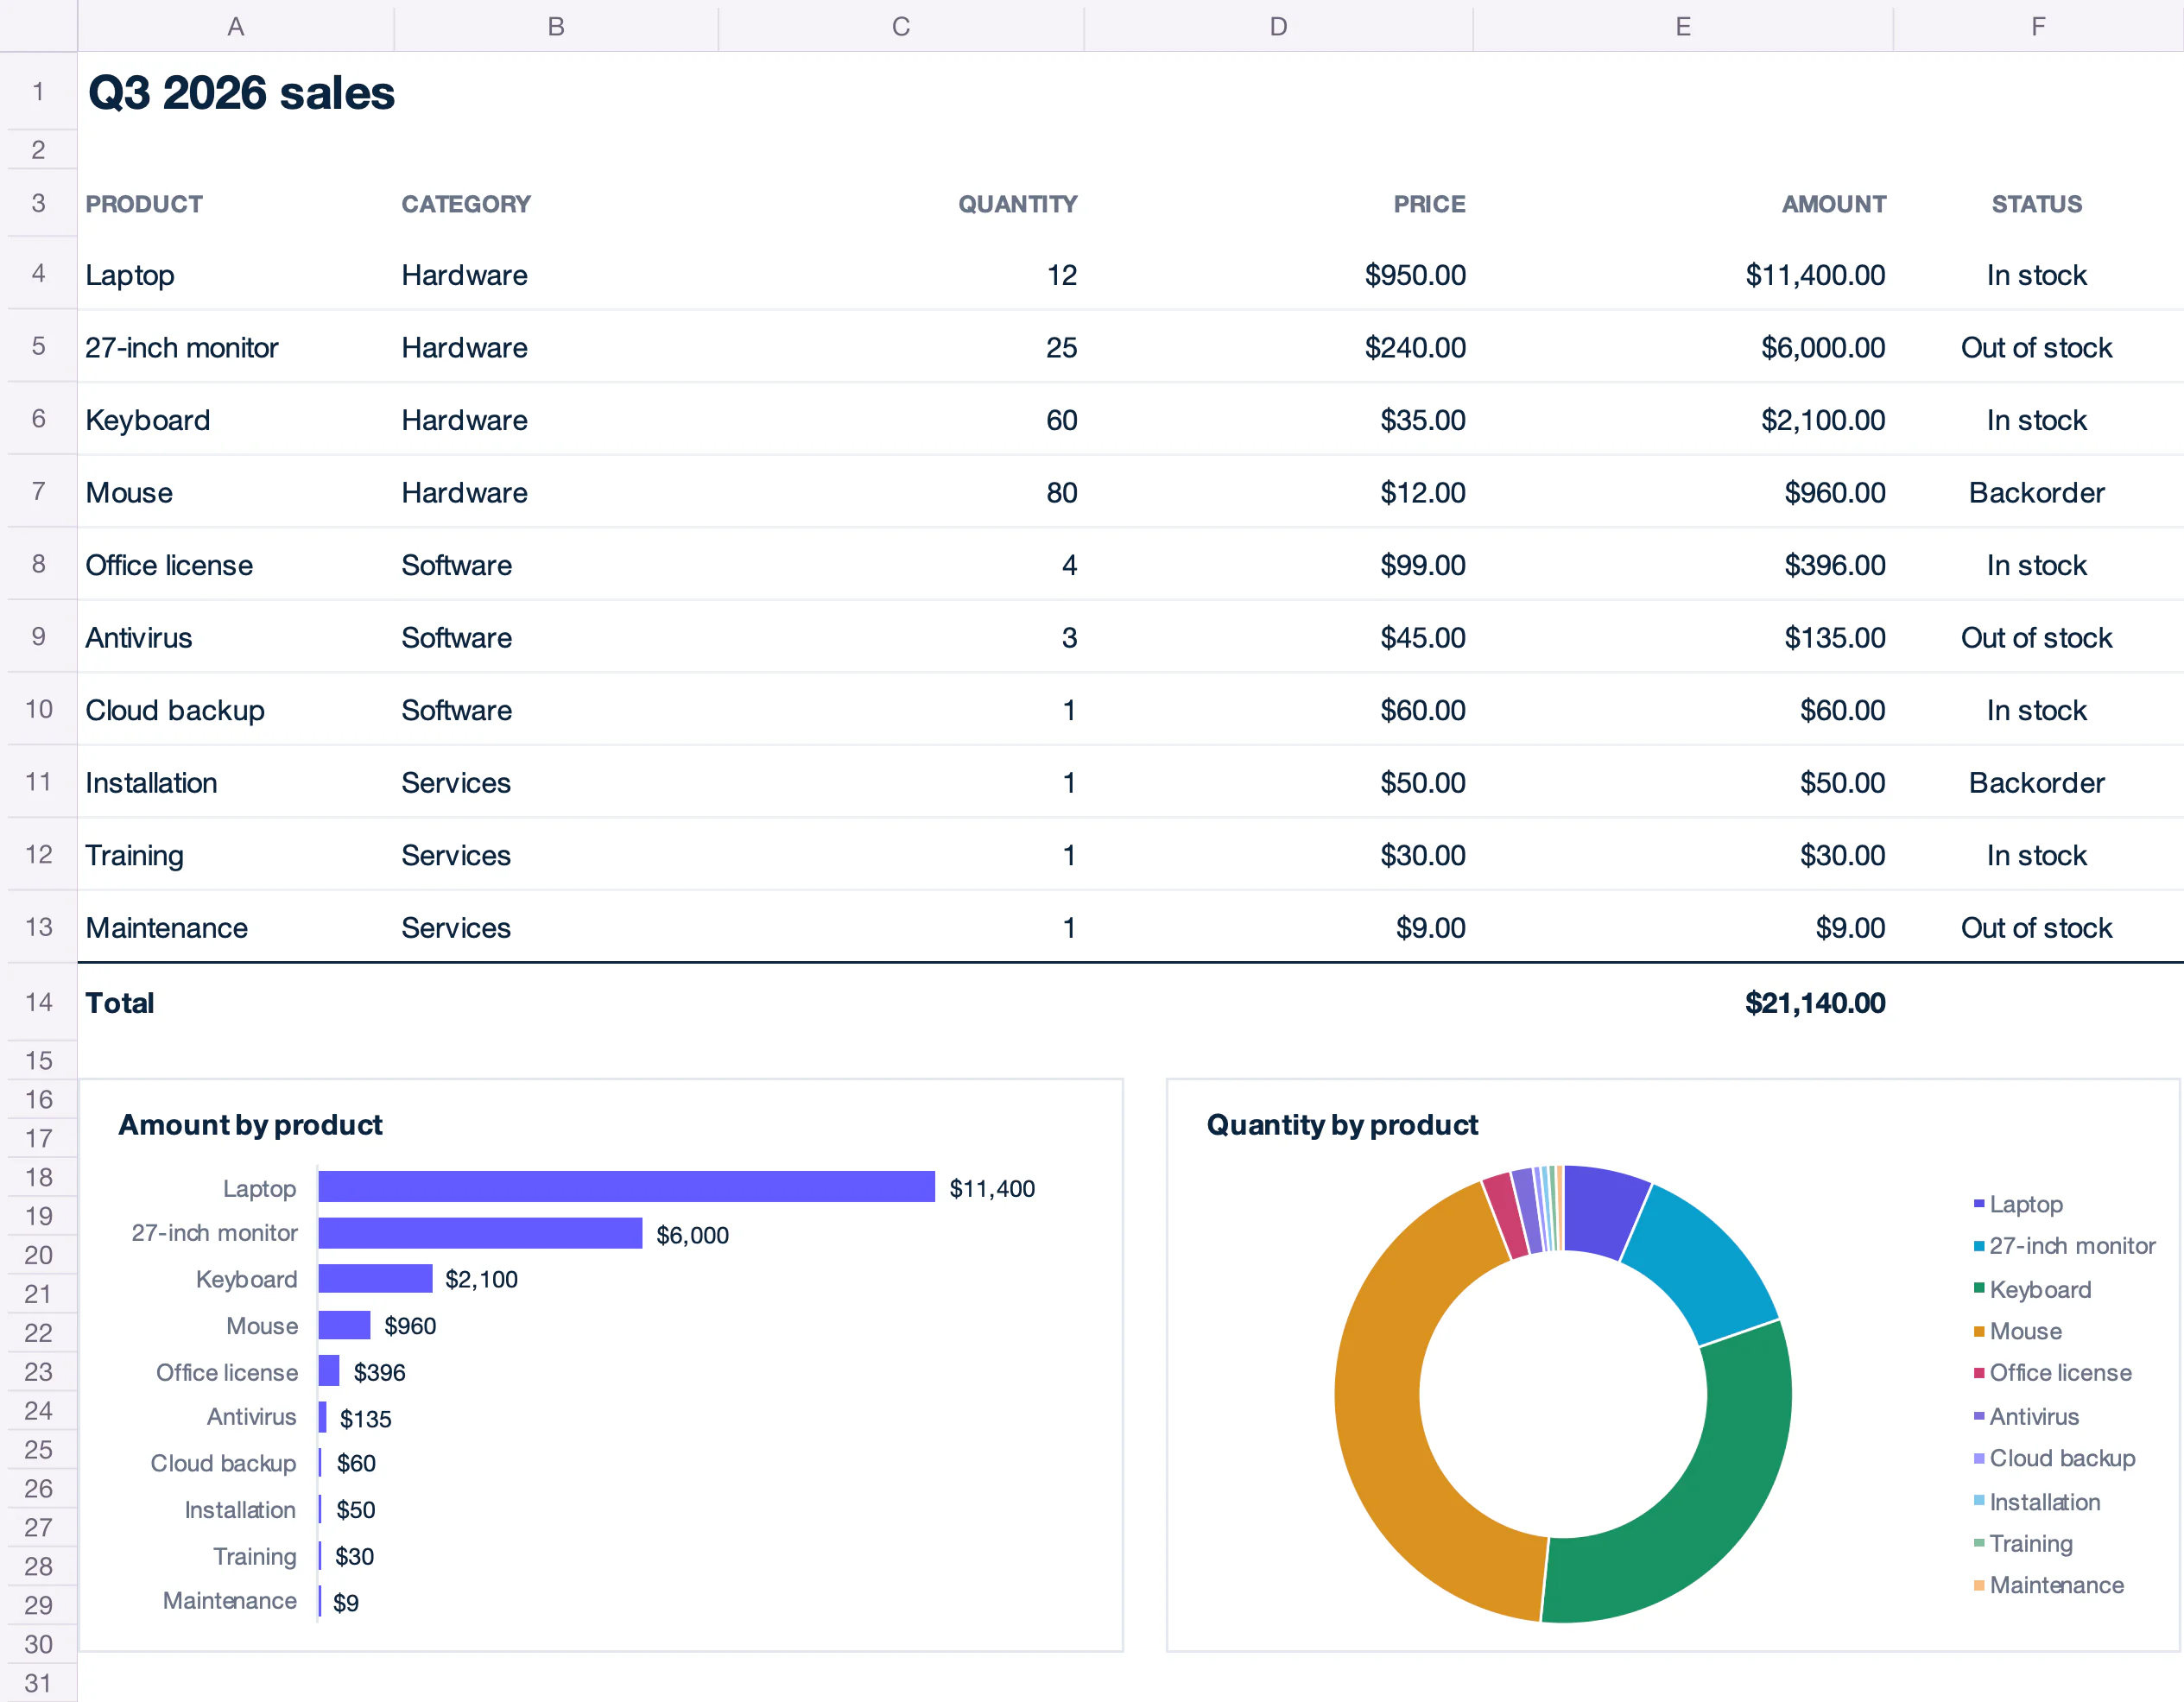
| Row | A | B | C | D | E | F |
|---|---|---|---|---|---|---|
| 1 | Q3 2026 sales | |||||
| 3 | PRODUCT | CATEGORY | QUANTITY | PRICE | AMOUNT | STATUS |
| 4 | Laptop | Hardware | 12 | 950 | 11400 | In stock |
| 5 | 27-inch monitor | Hardware | 25 | 240 | 6000 | Out of stock |
| 6 | Keyboard | Hardware | 60 | 35 | 2100 | In stock |
| 7 | Mouse | Hardware | 80 | 12 | 960 | Backorder |
| 8 | Office license | Software | 4 | 99 | 396 | In stock |
| 9 | Antivirus | Software | 3 | 45 | 135 | Out of stock |
| 10 | Cloud backup | Software | 1 | 60 | 60 | In stock |
| 11 | Installation | Services | 1 | 50 | 50 | Backorder |
| 12 | Training | Services | 1 | 30 | 30 | In stock |
| 13 | Maintenance | Services | 1 | 9 | 9 | Out of stock |
| 14 | Total | 21140 |
To draw a chart image from the data instead, use the :chart formatter.
Pivot tables
PRE-RELEASE v5.18.0+ Add {o.preReleaseFeatureIn=5018000} to the template.
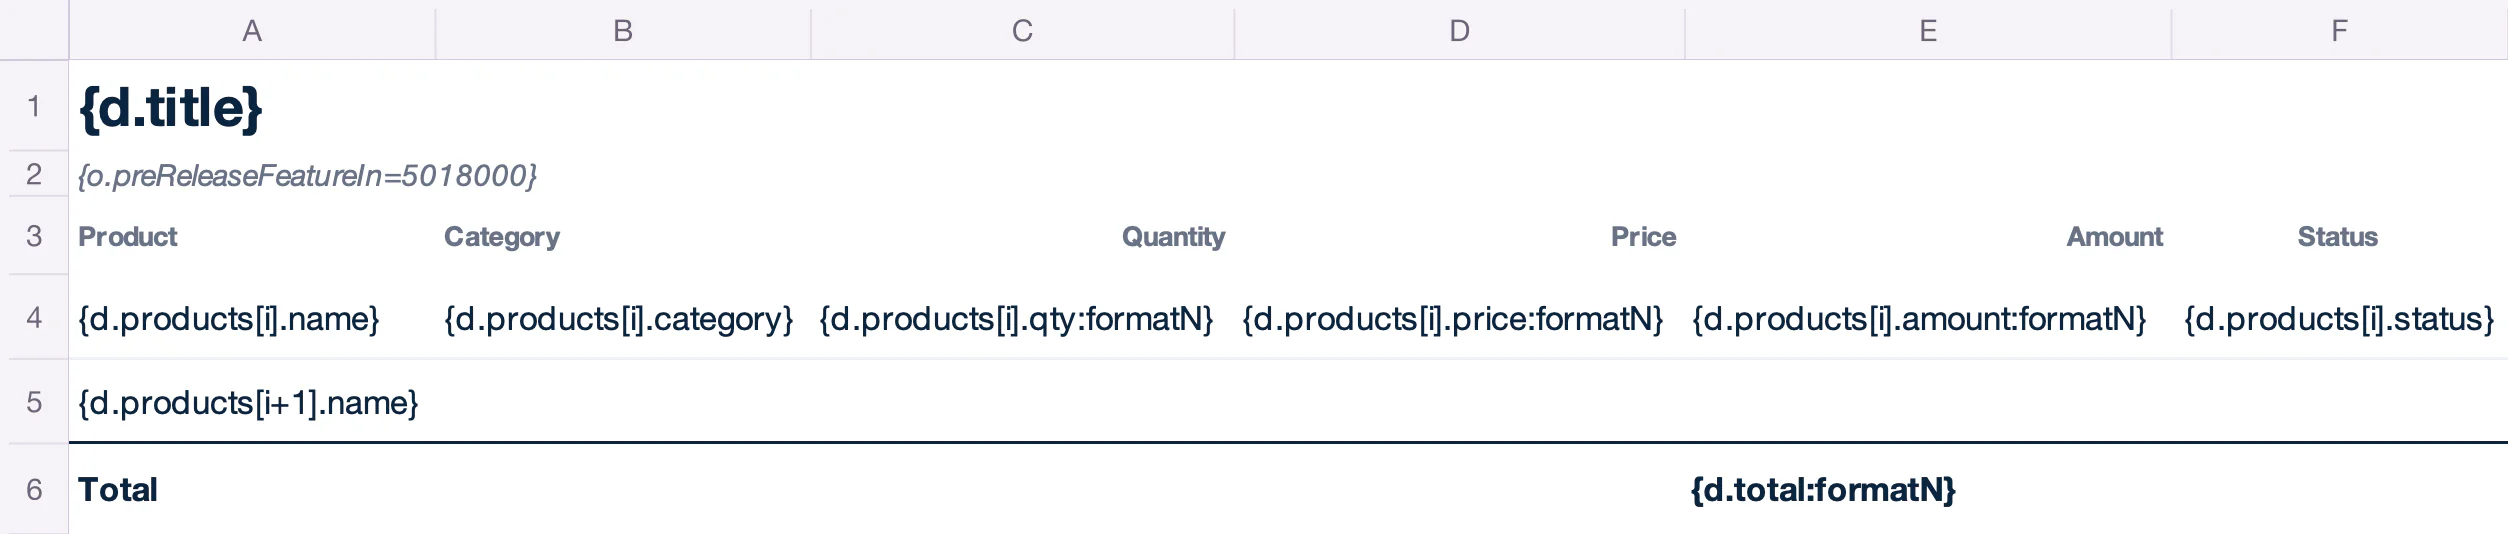
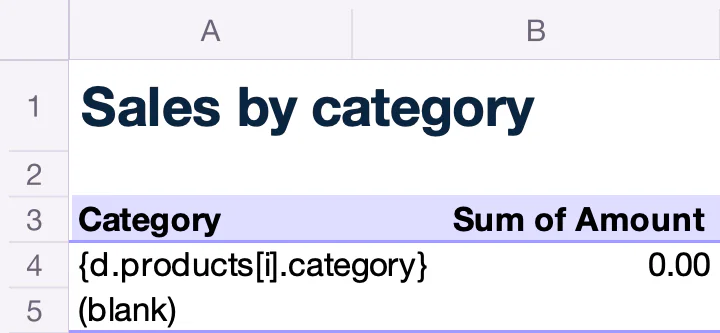
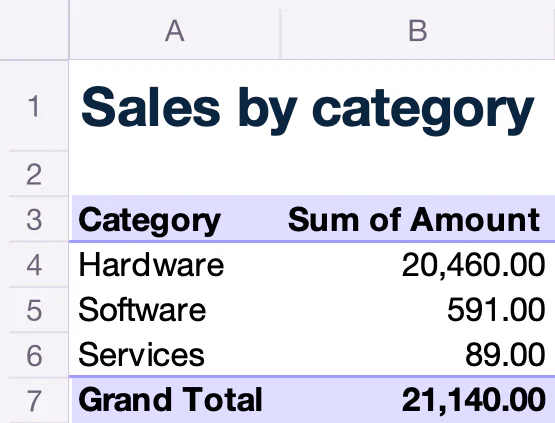
Build the pivot table from the cells of the loop. In this example, it is on another sheet. Its source covers all the generated rows, and Excel refreshes it when you open the file.
{
  "title": "Q3 2026 sales",
  "total": 21140,
  "products": [
    { "name": "Laptop",          "category": "Hardware", "qty": 12, "price": 950, "amount": 11400, "status": "In stock" },
    { "name": "27-inch monitor", "category": "Hardware", "qty": 25, "price": 240, "amount": 6000,  "status": "Out of stock" },
    { "name": "Keyboard",        "category": "Hardware", "qty": 60, "price": 35,  "amount": 2100,  "status": "In stock" },
    { "name": "Mouse",           "category": "Hardware", "qty": 80, "price": 12,  "amount": 960,   "status": "Backorder" },
    { "name": "Office license",  "category": "Software", "qty": 4,  "price": 99,  "amount": 396,   "status": "In stock" },
    { "name": "Antivirus",       "category": "Software", "qty": 3,  "price": 45,  "amount": 135,   "status": "Out of stock" },
    { "name": "Cloud backup",    "category": "Software", "qty": 1,  "price": 60,  "amount": 60,    "status": "In stock" },
    { "name": "Installation",    "category": "Services", "qty": 1,  "price": 50,  "amount": 50,    "status": "Backorder" },
    { "name": "Training",        "category": "Services", "qty": 1,  "price": 30,  "amount": 30,    "status": "In stock" },
    { "name": "Maintenance",     "category": "Services", "qty": 1,  "price": 9,   "amount": 9,     "status": "Out of stock" }
  ]
}
| Row | A | B | C | D | E | F |
|---|---|---|---|---|---|---|
| 1 | {d.title} | |||||
| 2 | {o.preReleaseFeatureIn=5018000} | |||||
| 3 | Product | Category | Quantity | Price | Amount | Status |
| 4 | {d.products[i].name} | {d.products[i].category} | {d.products[i].qty:formatN} | {d.products[i].price:formatN} | {d.products[i].amount:formatN} | {d.products[i].status} |
| 5 | {d.products[i+1].name} | |||||
| 6 | Total | {d.total:formatN} |
| Row | A | B | C | D | E | F |
|---|---|---|---|---|---|---|
| 1 | Q3 2026 sales | |||||
| 3 | Product | Category | Quantity | Price | Amount | Status |
| 4 | Laptop | Hardware | 12 | 950 | 11400 | In stock |
| 5 | 27-inch monitor | Hardware | 25 | 240 | 6000 | Out of stock |
| 6 | Keyboard | Hardware | 60 | 35 | 2100 | In stock |
| 7 | Mouse | Hardware | 80 | 12 | 960 | Backorder |
| 8 | Office license | Software | 4 | 99 | 396 | In stock |
| 9 | Antivirus | Software | 3 | 45 | 135 | Out of stock |
| 10 | Cloud backup | Software | 1 | 60 | 60 | In stock |
| 11 | Installation | Services | 1 | 50 | 50 | Backorder |
| 12 | Training | Services | 1 | 30 | 30 | In stock |
| 13 | Maintenance | Services | 1 | 9 | 9 | Out of stock |
| 14 | Total | 21140 |
Until the pivot table is refreshed, the file keeps the pivot values of the template. An application that does not refresh pivot tables when it opens a file shows these template values.
Hyperlinks
PRE-RELEASE v5.18.0+ Add {o.preReleaseFeatureIn=5018000} to the template.
A link in the repeated row is copied to each row. A link to a cell of the workbook, like "Go to total", still targets that cell after the rows are added. A link below the loop moves with its cell.
{
  "title": "Q3 2026 sales",
  "total": 21140,
  "products": [
    { "name": "Laptop",          "category": "Hardware", "qty": 12, "price": 950, "amount": 11400, "status": "In stock" },
    { "name": "27-inch monitor", "category": "Hardware", "qty": 25, "price": 240, "amount": 6000,  "status": "Out of stock" },
    { "name": "Keyboard",        "category": "Hardware", "qty": 60, "price": 35,  "amount": 2100,  "status": "In stock" },
    { "name": "Mouse",           "category": "Hardware", "qty": 80, "price": 12,  "amount": 960,   "status": "Backorder" },
    { "name": "Office license",  "category": "Software", "qty": 4,  "price": 99,  "amount": 396,   "status": "In stock" },
    { "name": "Antivirus",       "category": "Software", "qty": 3,  "price": 45,  "amount": 135,   "status": "Out of stock" },
    { "name": "Cloud backup",    "category": "Software", "qty": 1,  "price": 60,  "amount": 60,    "status": "In stock" },
    { "name": "Installation",    "category": "Services", "qty": 1,  "price": 50,  "amount": 50,    "status": "Backorder" },
    { "name": "Training",        "category": "Services", "qty": 1,  "price": 30,  "amount": 30,    "status": "In stock" },
    { "name": "Maintenance",     "category": "Services", "qty": 1,  "price": 9,   "amount": 9,     "status": "Out of stock" }
  ]
}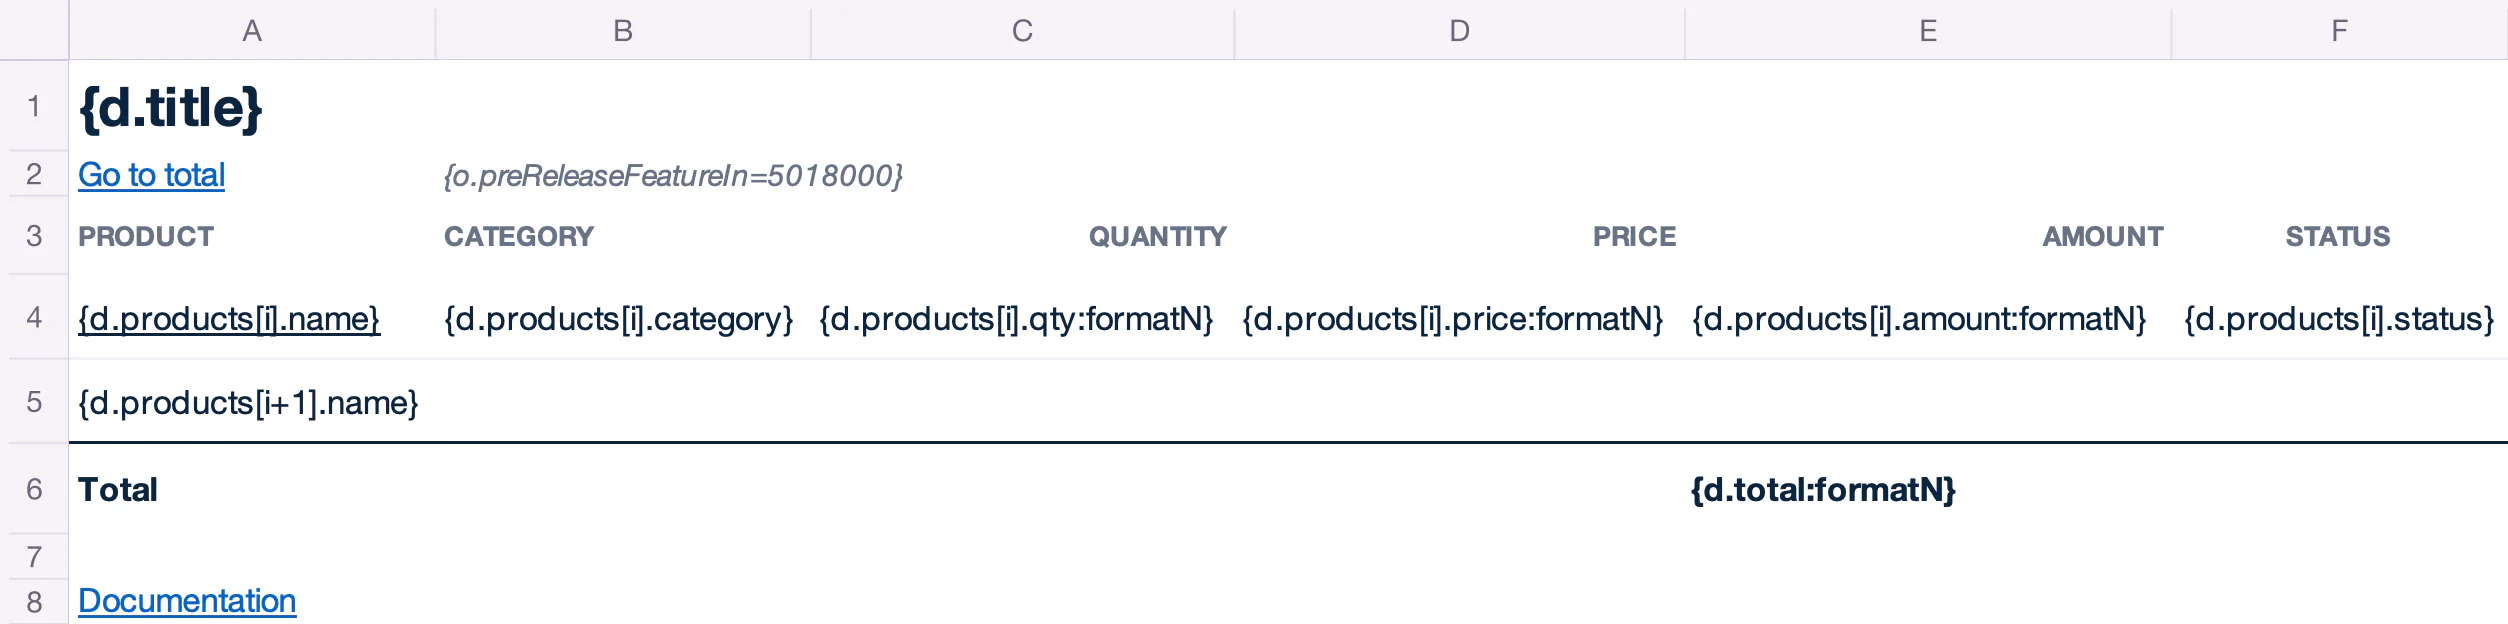
| Row | A | B | C | D | E | F |
|---|---|---|---|---|---|---|
| 1 | {d.title} | |||||
| 2 | Go to total | {o.preReleaseFeatureIn=5018000} | ||||
| 3 | PRODUCT | CATEGORY | QUANTITY | PRICE | AMOUNT | STATUS |
| 4 | {d.products[i].name} | {d.products[i].category} | {d.products[i].qty:formatN} | {d.products[i].price:formatN} | {d.products[i].amount:formatN} | {d.products[i].status} |
| 5 | {d.products[i+1].name} | |||||
| 6 | Total | {d.total:formatN} | ||||
| 8 | Documentation |
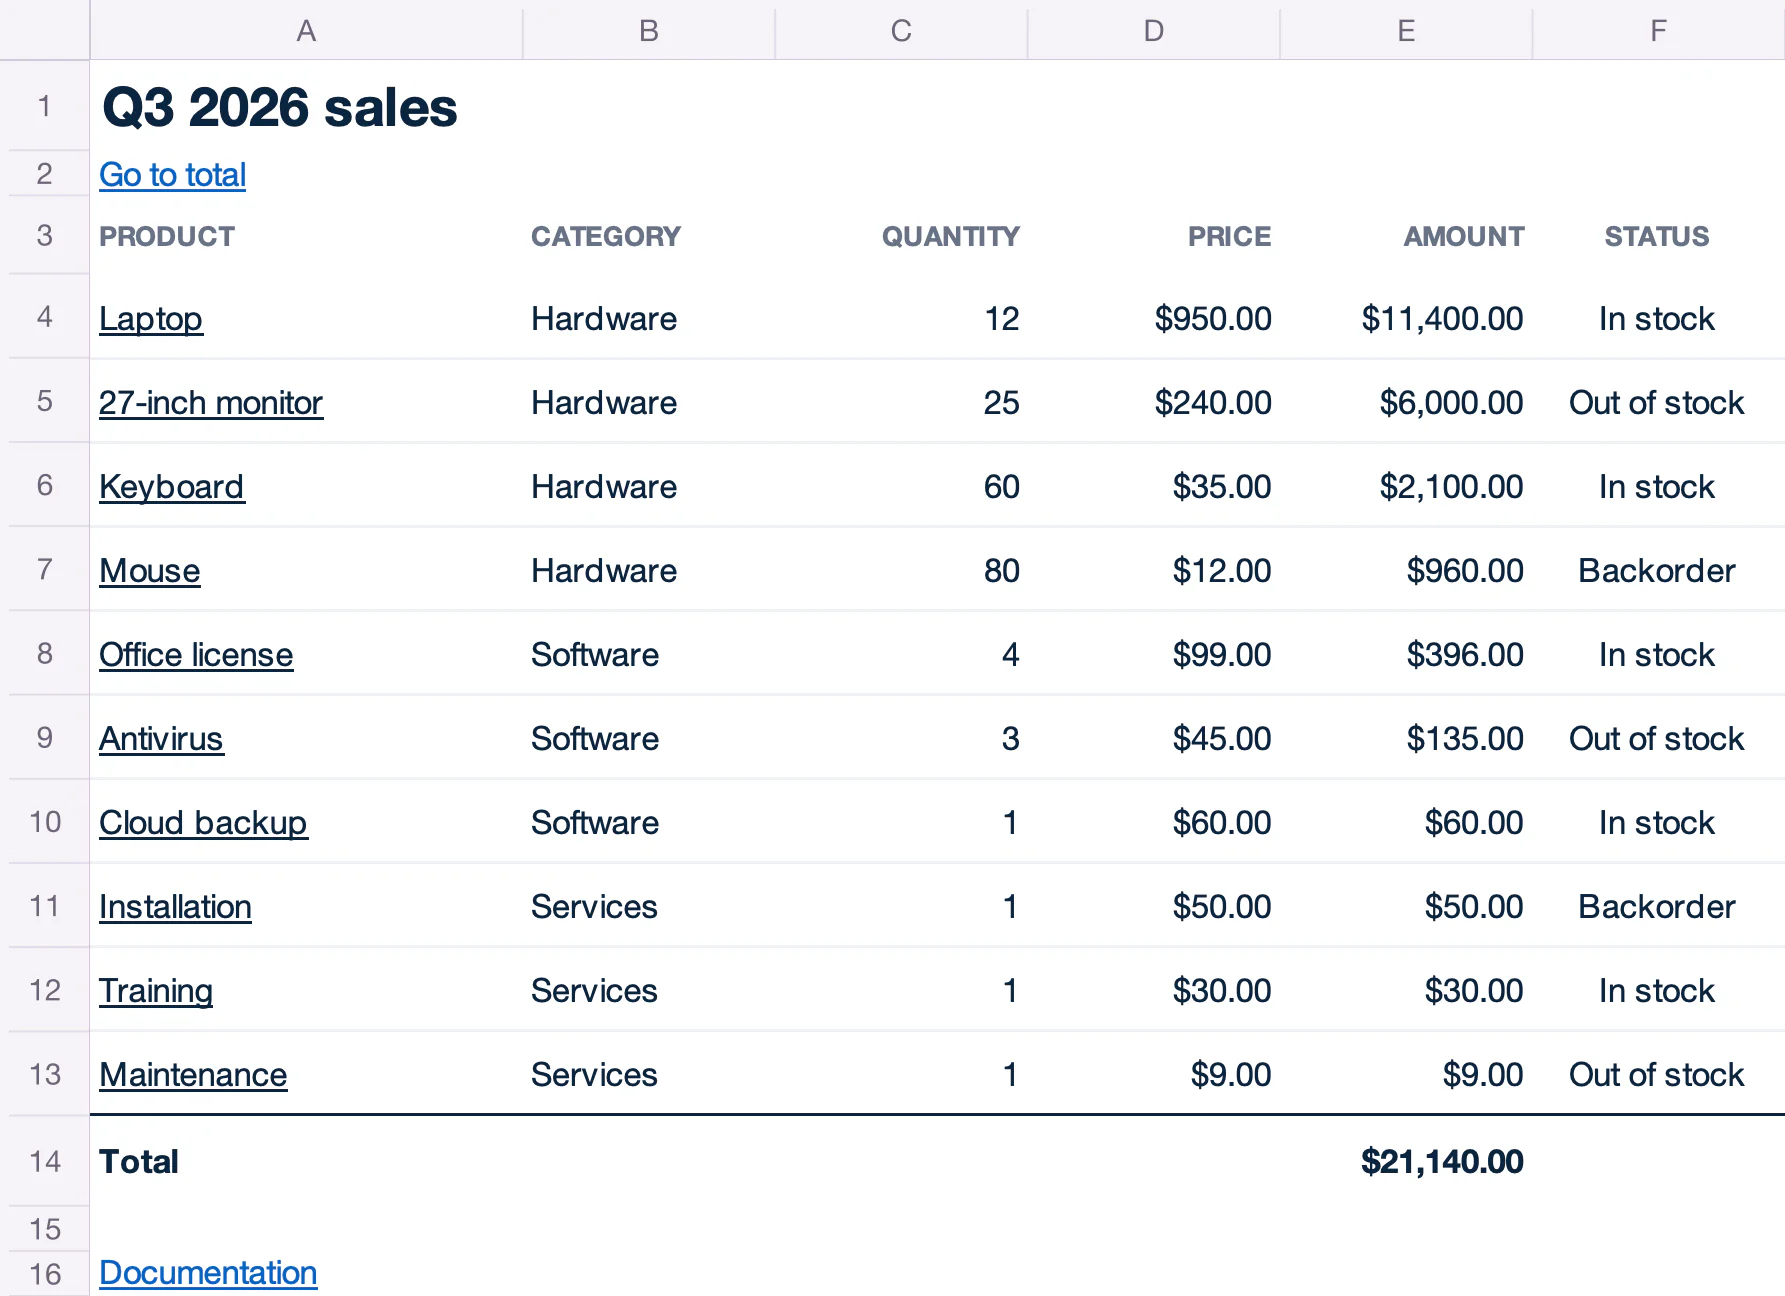
| Row | A | B | C | D | E | F |
|---|---|---|---|---|---|---|
| 1 | Q3 2026 sales | |||||
| 2 | Go to total | |||||
| 3 | PRODUCT | CATEGORY | QUANTITY | PRICE | AMOUNT | STATUS |
| 4 | Laptop | Hardware | 12 | 950 | 11400 | In stock |
| 5 | 27-inch monitor | Hardware | 25 | 240 | 6000 | Out of stock |
| 6 | Keyboard | Hardware | 60 | 35 | 2100 | In stock |
| 7 | Mouse | Hardware | 80 | 12 | 960 | Backorder |
| 8 | Office license | Software | 4 | 99 | 396 | In stock |
| 9 | Antivirus | Software | 3 | 45 | 135 | Out of stock |
| 10 | Cloud backup | Software | 1 | 60 | 60 | In stock |
| 11 | Installation | Services | 1 | 50 | 50 | Backorder |
| 12 | Training | Services | 1 | 30 | 30 | In stock |
| 13 | Maintenance | Services | 1 | 9 | 9 | Out of stock |
| 14 | Total | 21140 | ||||
| 16 | Documentation |
To build the address of a link from the data, see dynamic hyperlinks.
Pictures
Insert a temporary picture and write the tag in its alt text (right-click > Edit Alt Text), like {d.logo}. Carbone replaces it with the image from the data, given as a public URL or a Base64 data URI. The image is stretched to the size of the temporary picture, so give the temporary picture the same proportions as your images.
{
  "company": "Acme Corporation",
  "manager": "Jane Smith",
  "region": "North America",
  "period": "July to September 2026",
  "logo": "https://carbone.io/img/carbone_icon_v3_github.png"
}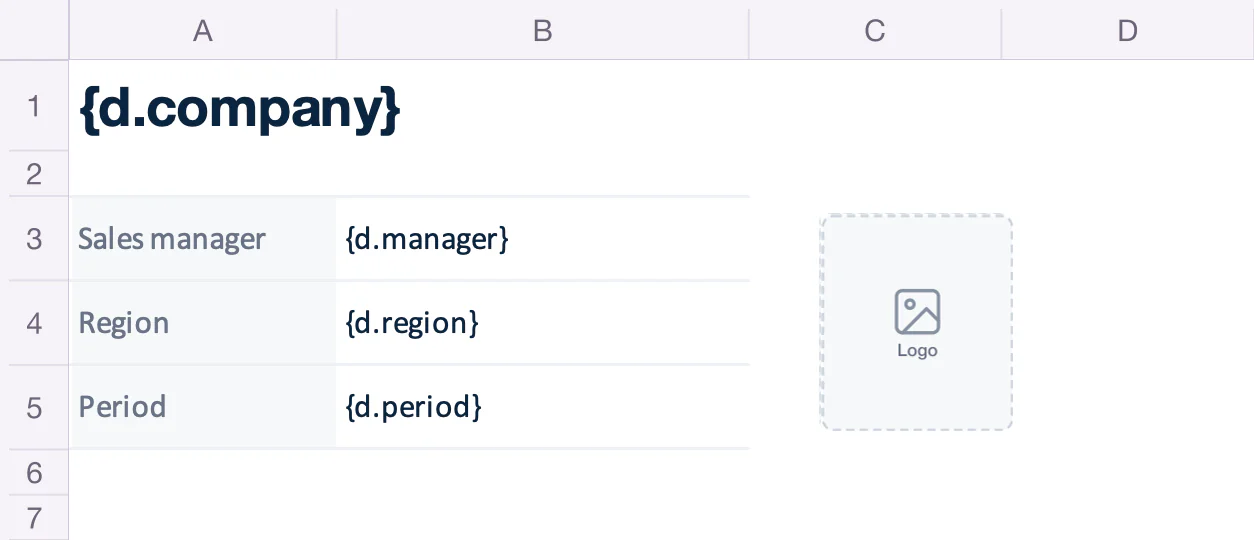
| Row | A | B |
|---|---|---|
| 1 | {d.company} | |
| 3 | Sales manager | {d.manager} |
| 4 | Region | {d.region} |
| 5 | Period | {d.period} |
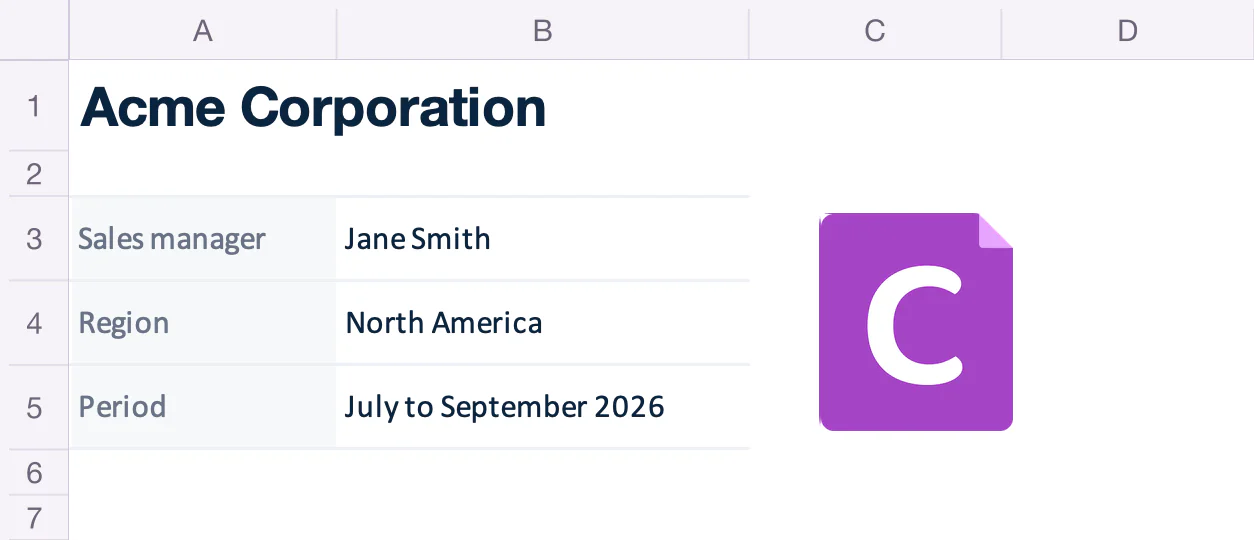
| Row | A | B |
|---|---|---|
| 1 | Acme Corporation | |
| 3 | Sales manager | Jane Smith |
| 4 | Region | North America |
| 5 | Period | July to September 2026 |
Loops do not repeat pictures. A picture in the repeated row stays on the first row. With the pre-release tag, pictures and comments below the loop move down with the rows. Learn more about pictures.
Barcodes
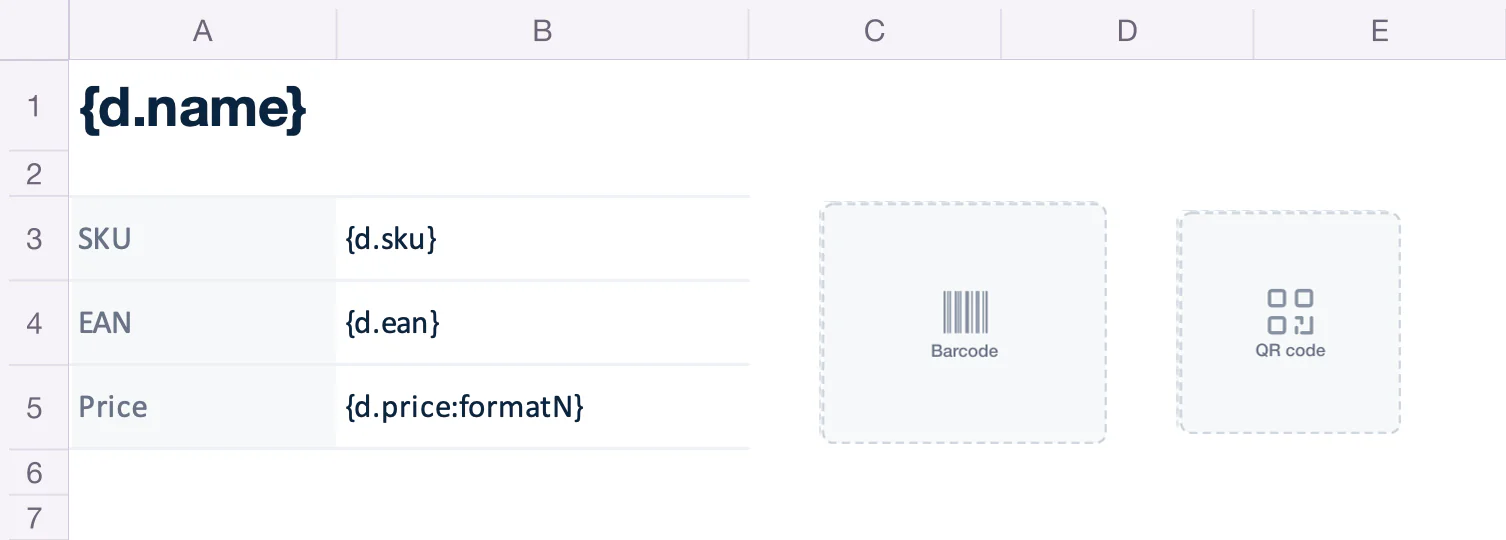
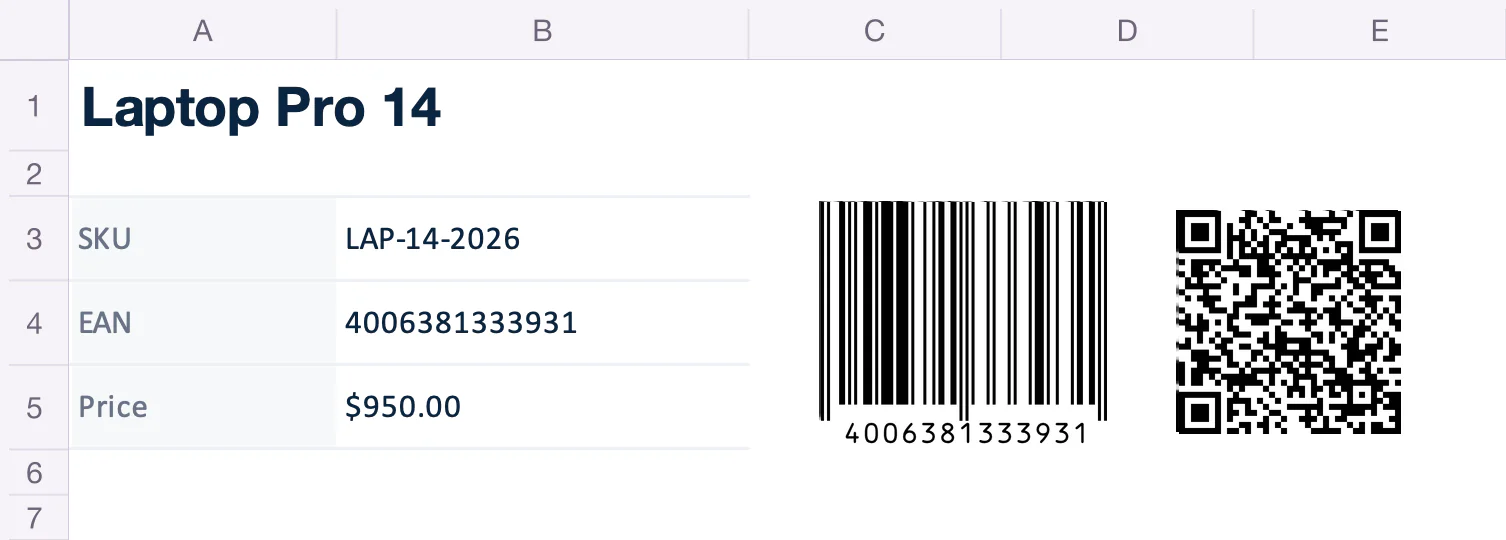
Barcodes are pictures too. Write the :barcode formatter in the alt text of a temporary picture. {d.ean:barcode(ean13, scale:6)} draws the EAN-13 code of the product, and {d.url:barcode(qrcode, scale:6)} draws a QR code of its web page.
{
  "name": "Laptop Pro 14",
  "sku": "LAP-14-2026",
  "ean": "4006381333931",
  "price": 950,
  "url": "https://carbone.io/documentation/design/template-formats/xlsx.html"
}
| Row | A | B |
|---|---|---|
| 1 | {d.name} | |
| 3 | SKU | {d.sku} |
| 4 | EAN | {d.ean} |
| 5 | Price | {d.price:formatN} |
| Row | A | B |
|---|---|---|
| 1 | Laptop Pro 14 | |
| 3 | SKU | LAP-14-2026 |
| 4 | EAN | 4006381333931 |
| 5 | Price | 950 |
The barcode is stretched to the size of the temporary picture, so keep the proportions of the barcode (square for a QR code). scale sets the resolution, from 1 to 10 (3 by default). Learn more about the barcode types and options.
Translations
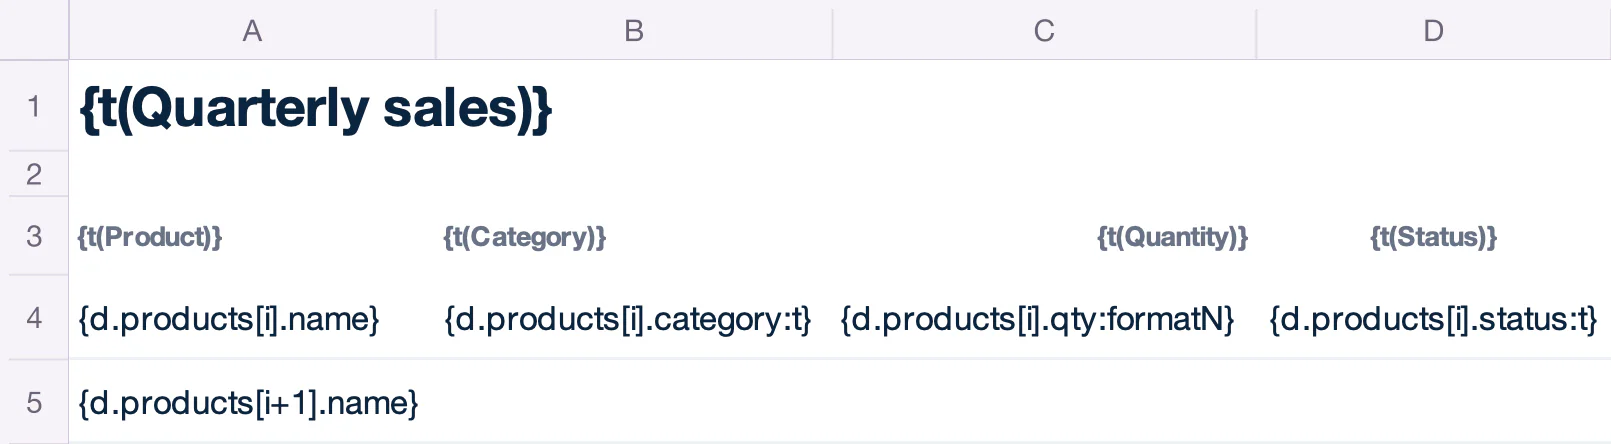
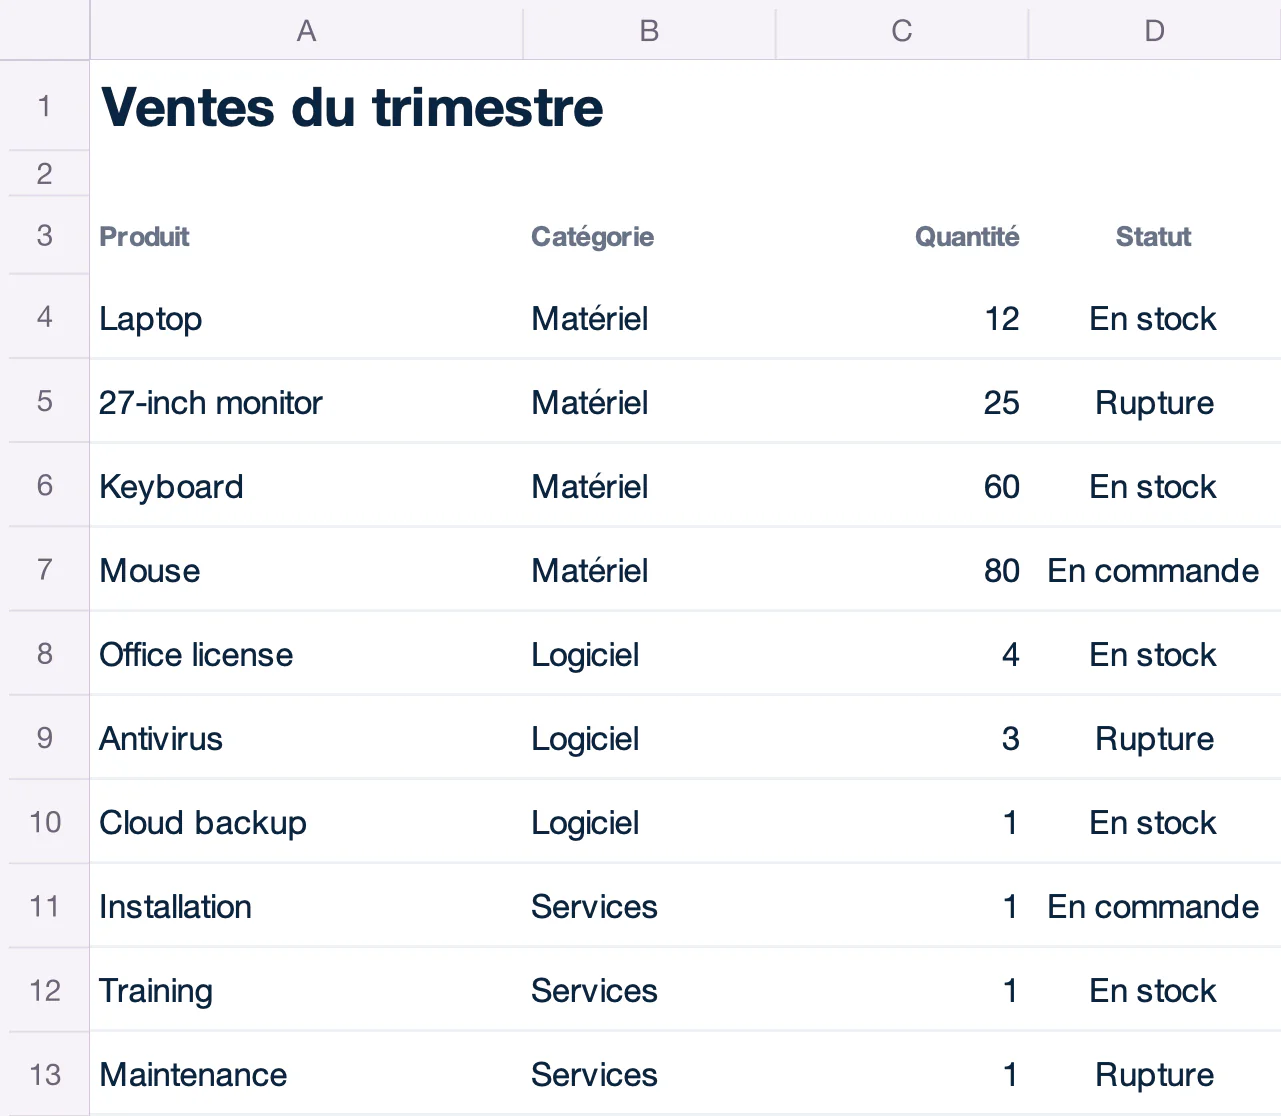
Write static text in {t( )} tags, and add the :t formatter to translate values from the data. Carbone uses the translations for the lang of the report. This example uses "lang": "fr-fr" and the dictionary in the Translations tab.
{
  "title": "Q3 2026 sales",
  "total": 21140,
  "products": [
    { "name": "Laptop",          "category": "Hardware", "qty": 12, "price": 950, "amount": 11400, "status": "In stock" },
    { "name": "27-inch monitor", "category": "Hardware", "qty": 25, "price": 240, "amount": 6000,  "status": "Out of stock" },
    { "name": "Keyboard",        "category": "Hardware", "qty": 60, "price": 35,  "amount": 2100,  "status": "In stock" },
    { "name": "Mouse",           "category": "Hardware", "qty": 80, "price": 12,  "amount": 960,   "status": "Backorder" },
    { "name": "Office license",  "category": "Software", "qty": 4,  "price": 99,  "amount": 396,   "status": "In stock" },
    { "name": "Antivirus",       "category": "Software", "qty": 3,  "price": 45,  "amount": 135,   "status": "Out of stock" },
    { "name": "Cloud backup",    "category": "Software", "qty": 1,  "price": 60,  "amount": 60,    "status": "In stock" },
    { "name": "Installation",    "category": "Services", "qty": 1,  "price": 50,  "amount": 50,    "status": "Backorder" },
    { "name": "Training",        "category": "Services", "qty": 1,  "price": 30,  "amount": 30,    "status": "In stock" },
    { "name": "Maintenance",     "category": "Services", "qty": 1,  "price": 9,   "amount": 9,     "status": "Out of stock" }
  ]
}{
"fr-fr": {
"Quarterly sales": "Ventes du trimestre",
"Product": "Produit",
"Category": "Catégorie",
"Quantity": "Quantité",
"Status": "Statut",
"Hardware": "Matériel",
"Software": "Logiciel",
"Services": "Services",
"In stock": "En stock",
"Out of stock": "Rupture",
"Backorder": "En commande"
}
}
| Row | A | B | C | D |
|---|---|---|---|---|
| 1 | {t(Quarterly sales)} | |||
| 3 | {t(Product)} | {t(Category)} | {t(Quantity)} | {t(Status)} |
| 4 | {d.products[i].name} | {d.products[i].category:t} | {d.products[i].qty:formatN} | {d.products[i].status:t} |
| 5 | {d.products[i+1].name} |
| Row | A | B | C | D |
|---|---|---|---|---|
| 1 | Ventes du trimestre | |||
| 3 | Produit | Catégorie | Quantité | Statut |
| 4 | Laptop | Matériel | 12 | En stock |
| 5 | 27-inch monitor | Matériel | 25 | Rupture |
| 6 | Keyboard | Matériel | 60 | En stock |
| 7 | Mouse | Matériel | 80 | En commande |
| 8 | Office license | Logiciel | 4 | En stock |
| 9 | Antivirus | Logiciel | 3 | Rupture |
| 10 | Cloud backup | Logiciel | 1 | En stock |
| 11 | Installation | Services | 1 | En commande |
| 12 | Training | Services | 1 | En stock |
| 13 | Maintenance | Services | 1 | Rupture |
Learn more about translations.
Page layout
Tags work in headers and footers (Page Layout > Header & Footer), next to the Excel page number fields. {d.company} in the header prints the company name on every page.
PRE-RELEASE v5.18.0+ With {o.preReleaseFeatureIn=5018000}, the print area covers the generated rows, and a manual page break below the loop moves with its row.
Sheets
Tags work in sheet names, as in cells. Excel limits sheet names to 31 characters. If a value makes the name longer, Excel reports a problem when it opens the file.
XLSX templates cannot create one sheet per item of an array yet. Use an ODS template instead, and convert it to XLSX.
Convert XLSX to PDF
To generate a PDF from an XLSX template with the Carbone API:
- Prepare two files: an XLSX template with Carbone tags, like
{d.name}, and the JSON data to populate it. You can use the files of the Loops example. - Generate the PDF in one of three ways:
- Use an official Carbone integration, like N8N, Make, Zapier, Airtable or Bubble.
- Use a Carbone SDK: Node.js, Go, Python, Java, JavaScript or PHP.
- Send a
POST /render/templateHTTP request to the Carbone API, like this curl command:
curl --location --request POST 'https://api.carbone.io/render/template?download=true' \
  --header 'carbone-version: 5' \
  --header 'Content-Type: application/json' \
  --header 'Authorization: Bearer API_TOKEN' \
  --data-raw "{
    \"data\": $(cat loops-data.json),
    \"template\": \"$(base64 -i loops-template.xlsx)\",
    \"convertTo\": \"pdf\"
  }" \
  --output report.pdf
💡 Linux users: replacebase64 -i loops-template.xlsxwithbase64 -w 0 loops-template.xlsx
Key parameters
| Parameter | Description |
|---|---|
template |
Your XLSX template, encoded as a Base64 string. |
data |
JSON data used to populate the template. |
convertTo |
"pdf", or another output format: "xlsx" (by default), "ods", "csv"... |
converter |
Optional: LibreOffice "L" (default) or OnlyOffice "O". See converters. |
?download=true |
Query parameter to download the document as a stream. |
Authorization |
Header required for the Carbone Cloud API. Get your API key here. |
Each sheet is printed with its own page setup: print area, orientation, scaling, headers and footers. For more details, refer to the Carbone API Documentation.