Accounts receivable aging report
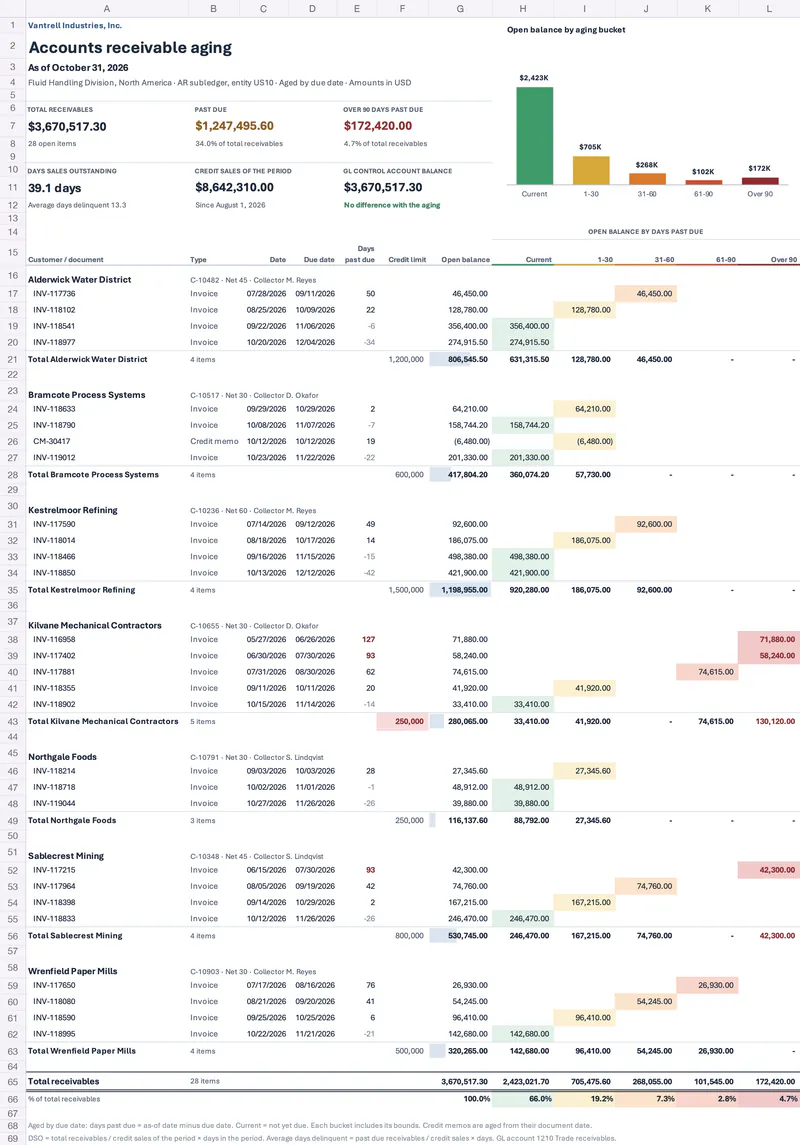
Open invoices by customer and aging bucket, reconciled to the GL
- Template
- XLSX
- Export as
- XLSX, PDF, ODS, CSV, HTML +19 more
- Carbone
- 5.18+
Generate AR aging reports from your ERP
Credit and collections teams run the accounts receivable aging every week and at month-end, one report per business unit, from the AR subledger of the ERP. Collectors use it to decide whom to call first, sales owners follow their accounts, and the controller checks that the total agrees with the GL control account before the close. The ERP sends the open items to the Carbone API as JSON and gets back a native Excel workbook. Days past due, buckets, subtotals and KPIs are Excel formulas, so the file recalculates when a collector changes the as-of date or an amount.
In this example, Vantrell Industries ages the 28 open items of its Fluid Handling division as of October 31, 2026. The company and its seven customers are fictional.
In this example, you will:
- Group the open items by customer with nested loops
- Write the dates and the amounts as native Excel values
- Age each item by due date with Excel formulas
- Compute the customer subtotals, the grand total and the % of total of each bucket
- Color the buckets from green to red and chart their distribution
- Compute DSO and reconcile the total with the GL
AR aging report structure
| Block | Content |
|---|---|
| Header | Company, as-of date, business unit, ledger, aging basis, currency |
| KPIs | Total receivables, past due, over 90 days, DSO, average days delinquent, credit sales, GL balance and difference |
| Customer | Name, account, payment terms, collector, then its open invoices and credit memos |
| Open item | Document number, type, date, due date, days past due, open balance, amount in its bucket |
| Customer total | Item count, credit limit, open balance and buckets |
| Totals | Total receivables and the % of total of each bucket: current, 1-30, 31-60, 61-90 and over 90 days past due |
The JSON holds the raw ledger data only. An excerpt:
{
  "company": "Vantrell Industries, Inc.",
  "asOf": "2026-10-31",
  "currency": "USD",
  "glAccount": "1210 Trade receivables",
  "glBalance": 3670517.3,
  "creditSales": { "from": "2026-08-01", "amount": 8642310 },
  "customers": [
    {
      "id": "C-10655",
      "name": "Kilvane Mechanical Contractors",
      "terms": "Net 30",
      "creditLimit": 250000,
      "collector": "D. Okafor",
      "items": [
        { "type": "Invoice", "number": "INV-116958", "date": "2026-05-27", "dueDate": "2026-06-26", "openAmount": 71880 },
        { "type": "Invoice", "number": "INV-118902", "date": "2026-10-15", "dueDate": "2026-11-14", "openAmount": 33410 }
      ]
    }
  ]
}
How to build an AR aging report in Excel
1. Write the header and the KPIs
A1: {d.company}{o.preReleaseFeatureIn=5018000}
A3: {d.asOf:diffD('2000-01-01','days'):mul(-1):add(36526):formatN}
A4: {d.businessUnit} · {d.ledger} · Aged by due date · Amounts in {d.currency}{o.preReleaseFeatureIn=5018000}prints nothing. It makes the formulas, the conditional formatting and the chart follow the generated rows.- Excel stores a date as a number of days. :diffD counts the days from January 1, 2000, and :add(36526) adds the Excel number of that date. With :formatN last, the cell is a real date, displayed by the cell format
"As of "mmmm d, yyyy. The same tag writes the invoice dates and the due dates. - The KPIs are formulas on the total row of the template:
=G22for total receivables,=G22-H22for past due,=L22for over 90 days. Carbone moves these references with the total row. - DSO is
=IF(B11=0,0,A7/B11*($A$3-B12+1)): total receivables divided by the credit sales of the period, times the days in the period. Average days delinquent uses the past due amount instead of the total. =ROUND(A7-E11,2)compares the aging with the balance of the GL control account. The cell format prints "No difference with the aging" when they agree.
2. Group the open items by customer
A16: {d.customers[i].name}
B16: {d.customers[i].id} · {d.customers[i].terms} · Collector {d.customers[i].collector}
A17: {d.customers[i].items[i].number}    G17: {d.customers[i].items[i].openAmount:formatN}
A18: {d.customers[i].items[i+1].number}
A19: Total {d.customers[i].name}
A21: {d.customers[i+1].name}
The nested loops repeat rows 16 to 20 for each customer, and row 17 for each open item. Rows 18 and 21 end the loops and are removed. Row 20 is the space between two customers.
3. Age each item by due date
- E17, days past due:
=$A$3-D17, the as-of date minus the due date. A negative number means the item is not due yet. - H17 to L17 put the open balance in one bucket, bounds included:
=IF($E17<=0,$G17,0)for Current,=IF(AND($E17>=1,$E17<=30),$G17,0)for 1-30, then 31-60, 61-90, and=IF($E17>90,$G17,0)for Over 90. - The bucket cells use the format
#,##0.00_);(#,##0.00);: the credit memo shows in parentheses, and the empty buckets show nothing.
4. Compute the subtotals and the totals
- B19 counts the items of the customer with :aggCount:
{d.customers[i].items[].openAmount:aggCount:formatN}. - The number of rows changes for each customer, so the subtotal reads this count:
=SUBTOTAL(9,OFFSET(G$1,ROW()-1-$B19,0,$B19))sums the rows above the customer total. - The total row sums the whole table with
=SUBTOTAL(9,G16:G21). Carbone extends the range to all the generated rows, and SUBTOTAL skips the customer subtotals. - Row 23 divides each bucket by the total:
=IF($G$22=0,0,H22/$G$22). G23 adds the five percentages, a check that prints 100.0%.
5. Color the risk and chart the buckets
The conditional formatting rules are defined on rows 17 and 19, and Carbone extends them to every customer:
- Each bucket of row 17 gets a fill when it is not zero, from muted green for Current to red for Over 90, so each item lights up in its bucket.
- E17 turns red above 90 days and gray for the items not due yet.
- On the customer total,
=AND($F19>0,$G19>$F19)highlights the credit limit when the balance exceeds it, and solid data bars compare the balances of the customers.
The chart sits above the table, next to the KPIs. Its categories are the bucket labels H15:L15 and its values the total row H22:L22, which Carbone moves below the generated rows.
6. Set up the page
Freeze the panes under the column labels in row 15, and repeat rows 14 and 15 on each printed page (Page Layout > Print Titles). The header and footer print {d.company}, the title and Page &P of &N, in landscape, fitted to the page width.
Related Examples
Trusted by 800+ paid customers in 40+ countries