Monthly sales report
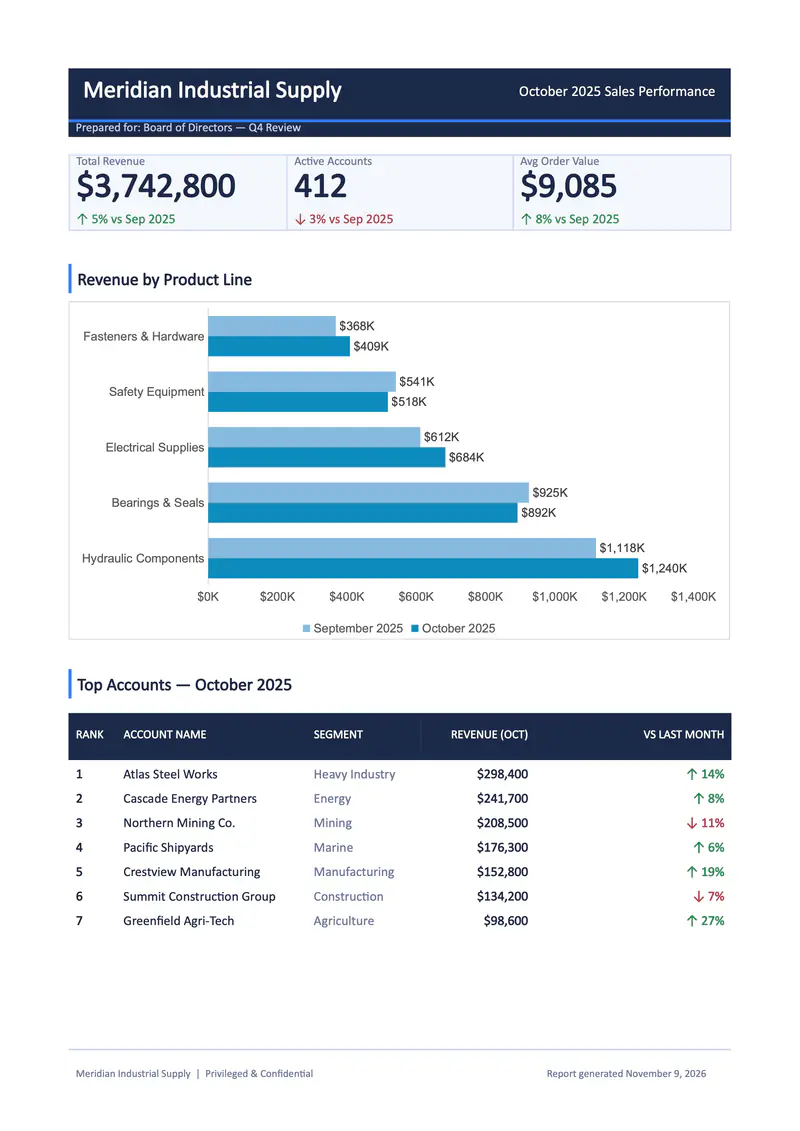
CRM figures with KPIs, a bar chart and top accounts
- Template
- DOCX
- Export as
- PDF, DOCX, ODT, HTML, PNG +25 more
- Carbone
- 4.0+
Generate sales reports from your CRM or ERP
Sales and finance teams send the month's figures from their CRM or ERP to the Carbone API as JSON and get back the performance report for management as a PDF.
Here, a DOCX template presents three KPIs, a bar chart comparing product line revenue over two months, and a ranking of the top accounts.
In this example, you will:
- Display KPIs with currency formatting
- Show colored up and down arrows based on a value
- Feed a native bar chart with a loop
- Display a ranking table
How to build a monthly sales report
Follow these steps to create your sales performance report:
1. Build the Header and the KPI Cards
- Insert tables for the header and the three KPI cards, and set their borders to None.
- Display the data with Carbone tags.
Example:
{d.report.title} - Format the amounts with :formatC.
Example:
{d.kpis.revenue.value:formatC(0)}
Tip: The currency depends on the lang and currencySource / currencyTarget options of the render request (here en-us and USD).
2. Add Trend Indicators
- Display an arrow with the conditional formatters ifGTE and show/elseShow, and remove the sign with :abs:
{d.kpis.revenue.deltaPct:ifGTE(0):show(↑):elseShow(↓)} {d.kpis.revenue.deltaPct:abs}% - Color the paragraph with :color:
{d.kpis.revenue.deltaPct:ifGTE(0):show(1F8A4C):elseShow(B23A48):color(p, text)}
3. Add a Bar Chart
- Insert a native chart, here a Clustered Bar chart.
- In the chart data sheet, define the series labels and a loop on the product lines:
|                            | {d.report.period.currentLabel}             | {d.report.period.previousLabel}             |
|----------------------------|--------------------------------------------|---------------------------------------------|
| {d.productLines[i].name}   | {d.productLines[i].currentMonth:formatN}   | {d.productLines[i].previousMonth:formatN}   |
| {d.productLines[i+1].name} | {d.productLines[i+1].currentMonth:formatN} | {d.productLines[i+1].previousMonth:formatN} |- Use :formatN so the chart receives numbers.
- Customize the chart in Word: legend, colors, Data Labels and number format (here
[$-409]$#,##0,"K"to display thousands with US separators).
4. Display the Top Accounts Table
- Insert a table with a header row, then display the accounts in a loop:
{d.topAccounts[i].name}in the first row and{d.topAccounts[i+1]}in the second. - Reuse the formatters of the previous steps for the revenue and the trend.
Example:{d.topAccounts[i].revenue:formatC(0)}
Tip: Spaces are allowed inside tags, for example {d.topAccounts[i] .revenue :formatC(0)}, so long tags wrap at a readable place in narrow cells.
Save the DOCX template, connect it to your JSON data, and let Carbone generate your sales performance report automatically.
Related Examples
Check out these similar templates to learn more:
Trusted by 800+ paid customers in 40+ countries