Excel payroll register
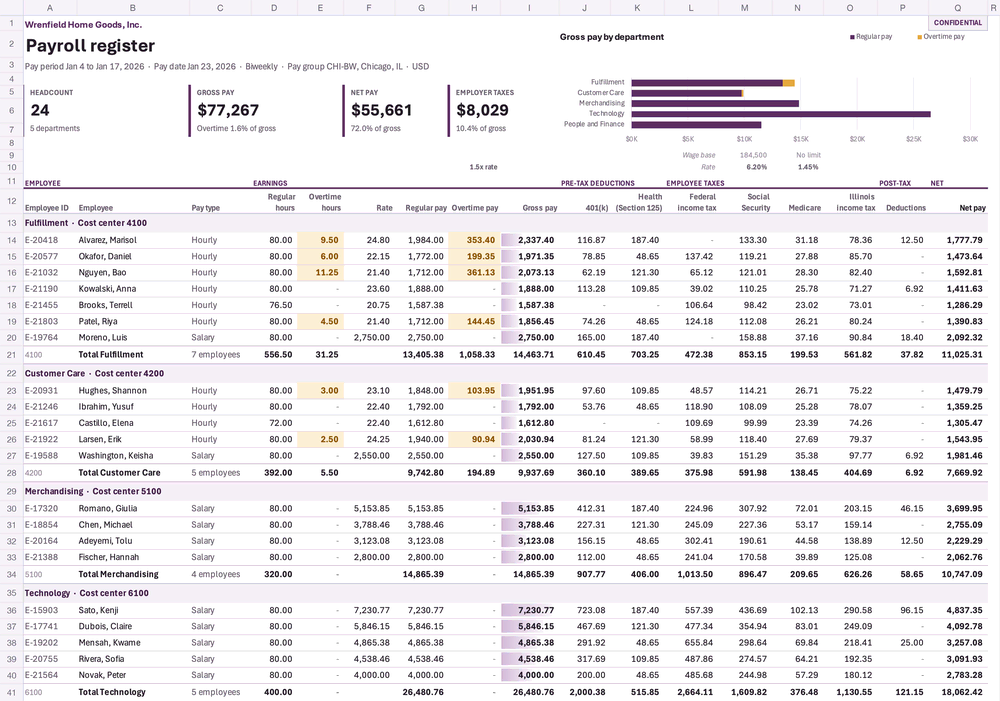
Biweekly pay, deductions, taxes and employer cost by department
- Template
- XLSX
- Export as
- XLSX, PDF, ODS, CSV, HTML +19 more
- Carbone
- 5.18+
- Nested loop
- Formula
- Subtotal
- Aggregation
- Conditional formatting
- Chart
- Number format
- Header and footer
Generate payroll registers from your payroll engine
Payroll teams produce a register for every pay run before the money moves. HR and finance review it, auditors sample it, and accounting posts it to the general ledger. The payroll engine or the HRIS sends the pay run to the Carbone API as JSON and gets back a native Excel file. Every amount the register computes is an Excel formula, so a reviewer can trace each net pay back to the hours, the rate and the deductions.
In this example, Wrenfield Home Goods, a fictional Chicago retailer, pays 24 employees every two weeks. The register covers the pay period from January 4 to January 17, 2026, paid on January 23. The JSON holds the inputs of the payroll engine: hours, rates, deductions and the income tax withholding of each employee. The register identifies employees by ID and name, with no Social Security numbers.
In this example, you will:
- Group the employees by department with nested loops
- Compute gross pay, Social Security, Medicare and net pay with Excel formulas
- Total each department and the pay group
- Highlight overtime and compare gross pay with conditional formatting
- Chart the gross pay of each department, then build the general ledger entry
How to build a payroll register in Excel
1. Write the header and the KPIs
Rows 1 to 3 hold the company and the pay run, with Carbone tags and :formatD:
A1: {d.company.name}
A3: Pay period {d.payroll.periodStart:formatD('MMM D')} to {d.payroll.periodEnd:formatD('MMM D, YYYY')}  ·  Pay date {d.payroll.payDate:formatD('MMM D, YYYY')}
The KPI tiles in rows 5 to 7 are formulas on the total row, like =I18 for the gross pay and =IF(I18=0,0,Q18/I18) for the net pay in percent of gross. When the loops add rows, Carbone moves the references to the new total row. The number of departments comes from the aggregator {d.departments[].costCenter:aggCount}.
Rows 9 and 10 hold the rates and the wage bases above the columns that use them, like {d.rates.socialSecurity:formatN} in M10 with the number format 0.00%. A single :formatN tag writes a native number, so the formulas can use it (numbers in XLSX).
2. Loop on the departments, then on the employees
The register uses nested loops on five rows:
Row 13: {d.departments[i].name}  ·  Cost center {d.departments[i].costCenter}
Row 14: {d.departments[i].employees[i].id}   {d.departments[i].employees[i].name}   {d.departments[i].employees[i].regularHours:formatN} ...
Row 15: {d.departments[i].employees[i+1].id}
Row 16: Total {d.departments[i].name}
Row 17: {d.departments[i+1].name}
Carbone removes rows 15 and 17, which only mark the end of each loop, and copies the styles and heights of the other rows.
3. Compute the pay with formulas
The data holds the inputs, and row 14 computes the rest. Carbone copies the formulas to each employee:
G14: =IF(C14="Salary",F14,ROUND(D14*F14,2))     Regular pay
H14: =ROUND(E14*F14*$H$10,2)                     Overtime pay, 1.5 times the rate
I14: =G14+H14                                    Gross pay
M14: =ROUND((I14-K14)*M$10,2)                    Social Security, 6.2% of FICA wages
N14: =ROUND((I14-K14)*N$10,2)                    Medicare, 1.45% of FICA wages
Q14: =I14-J14-K14-L14-M14-N14-O14-P14            Net pay
W14: =SUM(S14:V14)                               Employer taxes
FICA wages are the gross pay minus the Section 125 health premium in K14. The 401(k) deferral in J14 lowers the wages subject to income tax withholding, not the FICA wages, so the formulas do not subtract it. The federal and Illinois withholding, FUTA and SUTA come from the payroll engine, which applies the W-4 elections and the year-to-date wage bases.
4. Total each department and the pay group
- In the department total row,
{d.departments[i].employees[].id:aggCount:formatN}writes the number of employees in C16. The subtotals sum that many rows above:=SUBTOTAL(9,OFFSET(I16,-$C16,0,$C16,1)). - The total row sums the whole register with
=SUBTOTAL(9,I13:I17). SUBTOTAL skips the department subtotals, and Carbone extends the range to all the generated rows. - The recap below the register totals each cost center with
=SUMIF($A$13:$A$17,$A22,I$13:I$17), ready for the labor distribution.
5. Highlight overtime and chart the departments
Define the conditional formatting on row 14, and Carbone extends it to every employee:
- The formula rule
=$E14>0colors the overtime hours and pay in amber. - Data bars compare the gross pay of the employees.
The stacked bar chart in J2 reads the regular and overtime pay of the recap rows. It sits above the loops, and its series follow the generated rows.
6. Post the payroll to the general ledger
The general ledger entry debits the wages and the employer taxes, and credits the net pay and each liability, all with formulas on the total row. The debits must equal the credits: =IF(ROUND(G40-H40,2)=0,"Balanced","Out of balance") prints the result, and a rule colors it green. Next to it, the tax liabilities of the payroll are grouped by return: 941, 940, IL-941 and UI-3/40.
The header and footer of the printed pages show the company, the CONFIDENTIAL mark, the pay date and Page &P of &N (page layout). The pages print in landscape, fitted to the width, with the column headers repeated on each page.
This template requires Carbone v5.18.0 or later. The tag
{o.preReleaseFeatureIn=5018000}, stored in the comments of the document properties, makes the formulas, the conditional formatting, the chart and the print area follow the generated rows.
Related Examples
Trusted by 800+ paid customers in 40+ countries