Sales commission statement
Tiered commission, accelerators and clawbacks for each sales rep
- Template
- ODS
- Export as
- ODS, XLSX, PDF, CSV, HTML +19 more
- Carbone
- 5.18+
Generate commission statements from your sales commission software
Every month, sales operations sends each rep a commission statement before payroll: the deals credited in the period, the quota attainment, the commission earned in each tier of the plan, the adjustments to earlier statements and the amount paid. The deals come from the CRM, the plan rules and splits from the sales commission software, and the rep checks every line against the written plan. For employees working in California, that plan must state in writing how commissions are computed and paid (California Labor Code § 2751), and the statement applies those rules line by line.
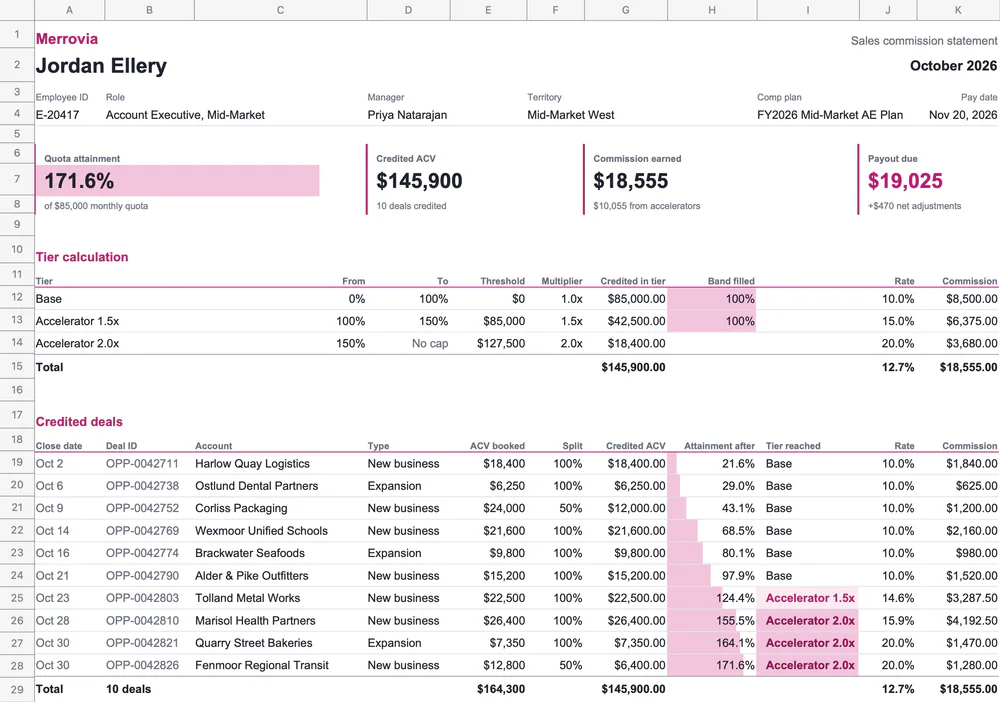
In this example, Merrovia, a fictional B2B software company, pays Jordan Ellery, a mid-market account executive, for October 2026 under a plan with a monthly quota, a base rate up to 100% of quota and two accelerators above it. You will:
- Fill the header and a KPI block with attainment, credited ACV, commission and payout
- List the credited deals with a loop and write amounts as native numbers
- Compute the credited amount, the attainment, the tier and the commission of each deal with formulas
- Sum the SPIFs, adjustments and clawbacks, then compute the payout and the year to date
- Flag the tiers with conditional formatting and show the attainment with data bars
How to build a commission statement spreadsheet
1. Fill the header and the KPI block
The header prints the rep, the plan and the pay date: {d.rep.name}, {d.plan.name} and {d.statement.payDate:formatD('MMM D, YYYY')} with :formatD. A cell becomes a number when it holds a single tag ending with :formatN, and the cell format displays it:
{d.plan.monthlyQuota:formatN}        cell format: "of --TMPL-5-MARK--quot;#,##0" monthly quota"
{d.deals[].id:aggCount:formatN}      cell format: 0" deals credited"
:aggCount counts the deals. The KPI cells reuse these numbers: the credited ACV is =SUM(OFFSET($G$19,0,0,$D$8,1)), the sum of as many deal rows as the count in D8, and the attainment is =$D$7/$A$8.
2. List the credited deals
One row repeats for each deal, and the end tag {d.deals[i+1]} sits alone on the next row:
{d.deals[i].closeDate:formatD('MMM D')}  {d.deals[i].id}  {d.deals[i].account}  {d.deals[i].type}
{d.deals[i].acv:formatN}  {d.deals[i].splitPct:formatN}
The ACV booked and the split are numbers in the cell formats "--TMPL-5-MARK--quot;#,##0 and 0"%". Every other value of the row is a formula.
3. Compute the tiers with formulas
In an ODS template, a formula keeps its cell addresses when Carbone repeats the row. Point at the current row with INDEX(column, ROW()), and keep every cell that formulas reference above the loop: the tier table sits above the deals, with its thresholds and rates.
Credited ACV      =INDEX(E:E,ROW())*INDEX(F:F,ROW())/100
Attainment after  =SUM($G$19:INDEX(G:G,ROW()))/$A$8
Tier reached      =IF(INDEX(H:H,ROW())<=$D$12,$A$12,IF(INDEX(H:H,ROW())<=$D$13,$A$13,$A$14))
The commission of a deal is the tiered commission after the deal minus the tiered commission before it, so a deal that crosses a threshold gets a blended rate, and the deal commissions add up to the tier table total. The tier table computes the credited amount of each band with =MAX(0,MIN($D$7,D12*$A$8)-E12) and its commission with =G12*J12. The total rows sum the generated rows with =SUM($K$19:INDEX(K:K,ROW()-1)). Learn more about formulas in spreadsheets.
4. Sum the adjustments and compute the payout
A second loop lists the SPIFs, adjustments and clawbacks with {d.adjustments[i].type} and {d.adjustments[i].amount:formatN}. The payout calculation sums each type of the rows above it:
=SUMIF($I$19:INDEX(I:I,ROW()-1),"Clawback",$K$19:INDEX(K:K,ROW()-1))The year-to-date block adds the period to the prior months sent in {d.ytdPrior.credited:formatN} and {d.ytdPrior.earned:formatN}, and recomputes the annual attainment.
5. Flag the tiers and show the attainment
Conditional formatting set on the range of the loop applies to every generated row. A formula rule such as I19=$A$14 highlights the deals in the top accelerator, and text rules flag the clawbacks in red and the adjustments in amber. Data bars scaled from 0% to 200% show the attainment after each deal and in the KPI block.
Related Examples
Check out these similar templates to learn more:
Trusted by 800+ paid customers in 40+ countries