Monthly management report
Variances, revenue bridge, working capital and outlook from your EPM
- Template
- PPTX
- Export as
- PDF, PPTX, ODP, PNG, SVG +29 more
- Carbone
- 5.18+
Generate monthly management reports from your ERP and EPM
A few working days after the books close, the FP&A team sends the monthly management report, often called the management pack, to the executive committee and the business unit heads. It shows the month and the year to date against budget and the latest forecast, explains the variances with an owner and an action, and ends with the outlook. Unlike statutory accounts, it has no required format, and every month the same deck is rebuilt by hand from the same systems.
Month-end reporting follows a fixed structure, so it automates well. The actuals come from the general ledger of the ERP, the budget, the forecast and the commentary from the EPM, the headcount from the HR system. Your reporting job sends them to the Carbone API as JSON and gets back the PowerPoint deck, with native tables and charts, ready for a last review before it goes out. Add "convertTo": "pdf" to the request to get the PDF.
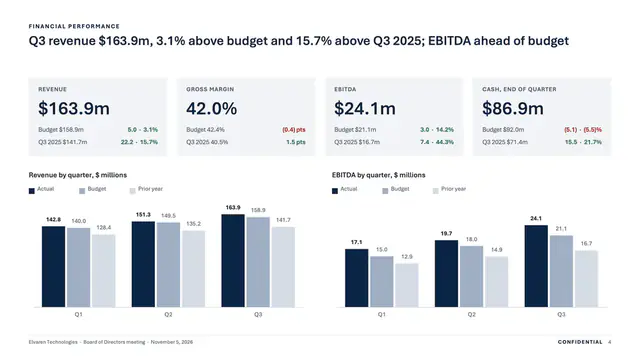
In this example, Brookvane Foods, a fictional packaged food maker with four business units, closes October 2026 on working day 4 and issues its report on November 9, in USD millions. The board pack of the quarter is a different document: see the quarterly board pack.
In this example, you will:
- Compute every variance in the template, favorable or unfavorable by line type, with unfavorable amounts in parentheses and red
- Draw the revenue bridge from budget to actual as a native PowerPoint chart
- Total the operating expenses, the headcount and the business units with aggregators
- Compute the days of working capital and the cash conversion cycle from the balances
- Reconcile the variances above threshold to the EBITDA variance
- Keep the table cells short with aliases
What the monthly management report contains
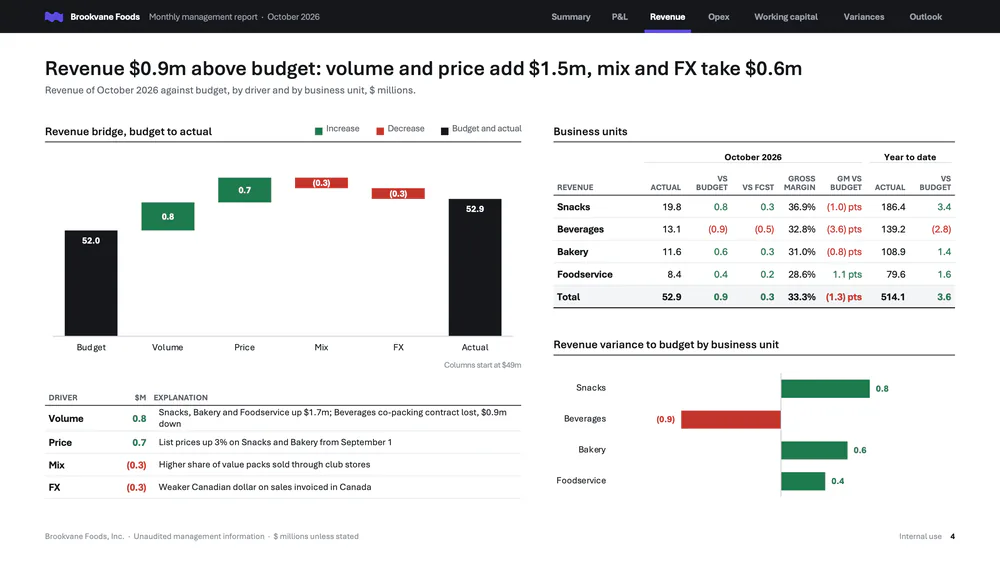
Each slide carries one message in an action title, and a section tracker in the dark band shows where the reader is. The tables, the charts and the titles read the same data, so the totals tie out from one slide to the next: the revenue of the bridge, of the business units and of the profit and loss is the same $52.9m.
| Slide | Content | What Carbone does |
|---|---|---|
| 1 Cover | Month, period, close day, issue and review dates, distribution, sources | Formats the dates |
| 2 Executive summary | Six KPIs, month and year to date, key messages, actions for the executive committee | Computes the variances and the vacancy rate, repeats the messages and the actions |
| 3 Profit and loss | Month: actual, budget, forecast; year to date: actual, budget; variances in amount and percent | Computes the variances by line type, the margins and the total operating expenses |
| 4 Revenue | Bridge from budget to actual by driver, business units, variance chart | Fills the bridge and the bar chart, sums the business units |
| 5 Operating expenses and headcount | Opex by department, year-to-date variance chart, FTE and open roles | Totals the departments and the functions |
| 6 Working capital | DSO, DIO, DPO and cash conversion cycle with a 12-month trend, net working capital, free cash flow | Computes the days from the balances, draws four sparklines |
| 7 Variances above threshold | EBITDA lines over the threshold: driver, explanation, owner, action | Repeats the variances, reconciles them to the EBITDA variance |
| 8 Trend and outlook | 12 months of actuals, forecast of November and December, full-year outlook, risks and opportunities | Fills two charts, computes the full-year outlook |
The variances follow the convention of the AFP glossary: revenue above budget is favorable, an expense above budget is unfavorable. The working capital days add up to the cash conversion cycle, DIO plus DSO minus DPO. As in the notation of ISO 24896, based on IBCS, actuals are solid columns and forecasts hatched, and green and red mark only favorable and unfavorable variances.
How to automate a monthly management report in PowerPoint
1. Write the action titles, the tracker and the footer
Each title is a single tag, like {d.titles.revenue}: FP&A writes the message of each slide in the EPM, and it arrives with the numbers. The dark band, the gray tracker and the footer sit on the slide layout, so they repeat on every slide: {d.company.shortName}, then Monthly management report · {d.report.periodEnd:formatD('MMMM YYYY')}. Each slide adds the white label and the violet marker of its own section on top. This example uses "lang": "en-us", so :formatD('MMMM YYYY') prints October 2026.
2. Compute the variances by line type
The profit and loss holds the figures of the ERP and the EPM with costs as positive amounts, and a sign on each line, 1 for revenue and profit, -1 for costs:
"pl": {
  "revenue":     { "sign": 1,  "mtd": { "actual": 52.9, "budget": 52.0, "forecast": 52.6 }, "ytd": { "actual": 514.1, "budget": 510.5 } },
  "costOfSales": { "sign": -1, "mtd": { "actual": 35.3, "budget": 34.0, "forecast": 34.5 }, "ytd": { "actual": 339.7, "budget": 335.3 } },
  "opex": [
    { "name": "Marketing", "sign": -1, "mtd": { "actual": 2.9, "budget": 2.6, "forecast": 2.8 }, "ytd": { "actual": 27.9, "budget": 26.5 } }
  ]
}
{d.pl.revenue.mtd.actual:sub(.budget):mul(..sign):formatN(1, acc)}prints the variance: actual minus budget, multiplied by the sign of the line..budgetis the attribute next toactual, and..signthe attribute of the parent object. A positive variance is always favorable: 0.9 on revenue, (1.3) on cost of sales. Theaccoption of :formatN puts negative amounts in parentheses.- The same tag with
:sub(.forecast)compares the month to the forecast, and:div(.budget):mul(100)gives the variance in percent. - The departments are a loop in the table: the row with
{d.pl.opex[i].name}, then the row with{d.pl.opex[i+1].name}that ends the loop. - The gross margin variance is in percentage points:
{d.pl.grossProfit.mtd.actual:div(d.pl.revenue.mtd.actual):sub(d.pl.grossProfit.mtd.budget / d.pl.revenue.mtd.budget):mul(100):formatN(1, acc)} pts. A formatter accepts a calculation of several paths.
A parametrized alias writes each formula once. The cover defines {#var($line, $per, $ref) = d.pl.$line.$per.actual:sub(.$ref):mul(..sign)}, and a cell of the table only holds {$var(revenue, mtd, budget):formatN(1, acc)}. In the loop, it becomes {$var(opex[i], ytd, budget):formatN(1, acc)}.
3. Color the variances
A second alias holds the color rule: {#fav = ifLT(-0.04):show(C2352B):ifGT(0.04):show(1D7A4E):elseShow(5E636E)}. In each variance cell, :color applies it to the text: {$var(revenue, mtd, budget):$fav:color(cell, text)}. The tag prints nothing, so it sits in the same run as the value, right after {$var(revenue, mtd, budget):formatN(1, acc)}. A nil variance stays gray. On the KPI tiles, :color(shape, text) colors the text box.
4. Draw the revenue bridge
The bridge is a stacked column chart (Insert > Chart > Stacked Column): an invisible base, the increases in green, the decreases in red, the budget and the actual in black. The EPM sends the drivers only:
"bridge": {
  "budget": 52.0,
  "actual": 52.9,
  "steps": [
    { "label": "Volume", "value": 0.8, "comment": "Snacks, Bakery and Foodservice up $1.7m; Beverages co-packing contract lost, $0.9m down" },
    { "label": "Mix", "value": -0.3, "comment": "Higher share of value packs sold through club stores" }
  ]
}
Four :set tags, at the end of the lede of the slide, add the columns of the chart to each step:
{d.bridge.budget:mul(0.95):floor:set(d.bridge.floor)}
{d.bridge.steps[].value:abs:add(.value):div(2):set(.increase)}
{d.bridge.steps[].value:abs:sub(.value):div(2):set(.decrease)}
{d.bridge.steps[].value:cumSum:add(d.bridge.budget):sub(.increase):set(.base)}
:cumSum gives the running total after each step, so the base is where the column starts. The data sheet of the chart (right-click > Edit Data) has the budget on row 2, the loop on rows 3 and 4 with {d.bridge.steps[i].label}, {d.bridge.steps[i].base:sub(d.bridge.floor)}, {d.bridge.steps[i].increase} and {d.bridge.steps[i].decrease}, then the actual on row 5. Each cell of a loop row holds a tag, even the zeros: {d.bridge.steps[i].value:mul(0)}. The columns start at the floor, $49m, so that a $0.3m step stays visible, and the slide says so. The labels of the budget and actual columns come from their number format, "{d.bridge.budget:formatN(1)}";;;, because their values are measured from the floor. Learn more about charts in PPTX templates.
The variance charts by business unit and by department are clustered bar charts with one green and one red series. {d.units[i].mtd.revenue.actual:sub(.budget):abs:add(.actual):sub(.budget):div(2)} keeps the favorable part, and the same formula with :mul(-1) after :abs keeps the unfavorable part.
5. Compute the totals and the working capital
- An aggregator sums each column:
{d.pl.opex[]:print(.mtd.actual):aggSum:formatN(1)}for the operating expenses,{d.headcount[]:print(.actual):aggSum:formatN(0)}for the headcount.:printreads a value inside a sub-object of each item. - The days of working capital are computed from the balances and the activity of the last three months:
{d.wc.actual.receivables:div(.revenue3m):mul(.days):set(d.wc.actual.dso)}stores 34 days, and{d.wc.actual.dso:add(.dio):sub(.dpo):set(d.wc.actual.ccc)}the cash conversion cycle. The same tags run for the prior month and the budget, and the KPI tile of the summary reads{d.wc.actual.ccc:formatN(0)} days. - The full-year outlook adds the forecast months to the actuals:
{d.trend[]:print(.revenue.forecast):aggSum:add(d.pl.revenue.ytd.actual):formatN(1)}prints 623.1.
6. Reconcile the variances to EBITDA
The variances slide lists the EBITDA lines above the threshold, with their driver, owner and action. Below the loop, {d.variances[]:print(.mtd):aggSum:set(c.listedMtd)} stores their total, and the "Other lines" row prints {d.pl.ebitda.mtd.actual:sub(.budget):sub(c.listedMtd):formatN(1, acc)}. The last row is the EBITDA variance of the profit and loss: (0.5) above threshold plus 0.4 on the other lines gives (0.1).
7. Chart the trend and the outlook
The trend charts loop on 14 months: {d.trend[i].month:formatD('MMM YY')}, {d.trend[i].revenue.actual}, {d.trend[i].revenue.forecast} and {d.trend[i].revenue.budget}. The actual and forecast series are stacked: a month has a value in one of them and zero in the other, so it shows one column, solid for the actuals and hatched for the forecast. The budget is a line series with a marker and no line.
Related Examples
Trusted by 800+ paid customers in 40+ countries