Utility invoice with payment slip
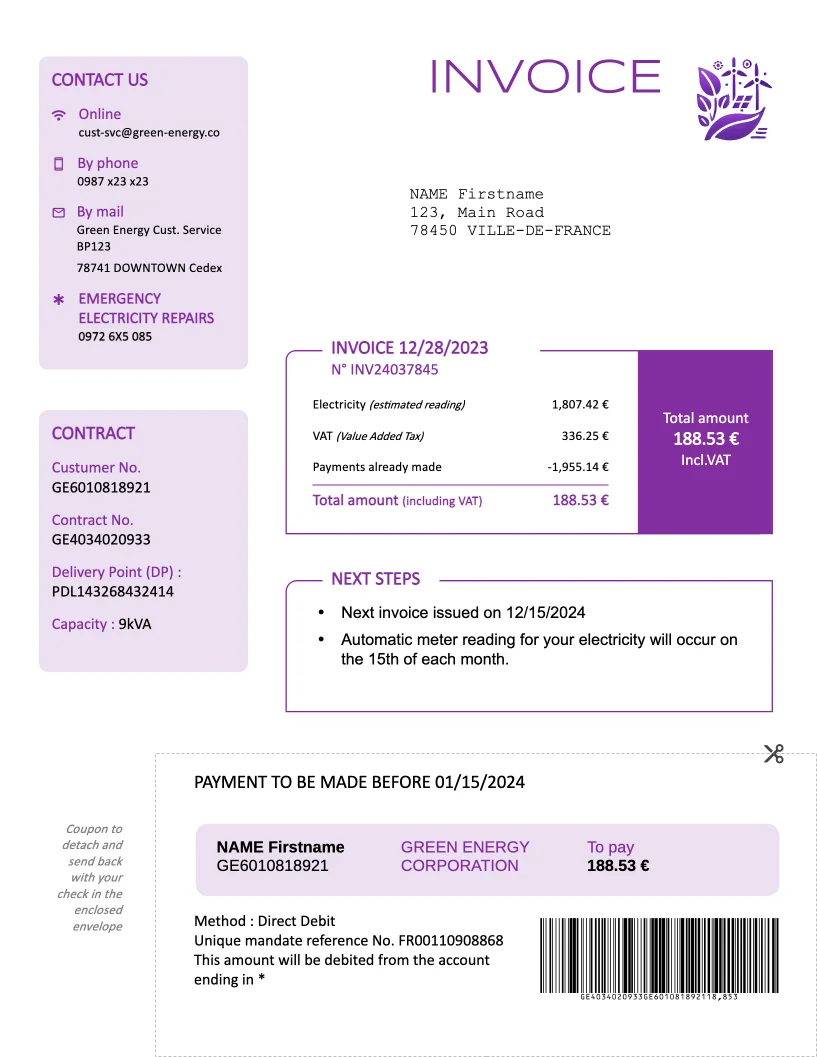
Electricity bill with meter readings, taxes and a barcode slip
- Template
- DOCX
- Export as
- PDF, DOCX, ODT, HTML, PNG +25 more
- Carbone
- 5.18+
Generate electricity invoices from your utility billing system
Energy suppliers issue an invoice for every customer at each billing cycle. The billing system sends the contract, the meter readings received from the network operator, the prices and the tax rates to the Carbone API as JSON, and gets back the PDF that goes to print and to the customer area.
This example is the monthly invoice of a fictional French electricity supplier. Page 1 summarizes the account, the amount due and the payment instructions, with a detachable payment slip at the bottom. Page 2 details the meter readings, the charges line by line and the consumption over 12 months. The content follows the French rules for household electricity invoices (arrêté of 18 April 2012), with the tax rates in force in October 2026.
In this example, you will:
- Compute the consumption, the charges, the taxes and the total from raw meter indexes and prices
- Repeat the meter registers in the readings table and in the charges table
- Show the payment instructions that match the customer's payment method
- Keep a detachable payment slip at the bottom of page 1, with a Code 128 barcode
- Chart 12 months of consumption, with estimated months in a lighter color
How to build an electricity invoice with a payment slip
1. Compute the invoice from the raw data
The JSON holds the meter indexes, the unit prices and the tax rates, never a computed amount. The template computes each value once, with tags written next to the logo, in the same paragraph:
{d.registers[].currIndex:sub(.prevIndex):set(.kwh)}
{d.registers[].kwh:mul(.unitPrice):round(2):set(.amount)}
{d.registers[].kwh:aggSum:set(c.kwh)}
{d.registers[].amount:aggSum:round(2):set(c.energy)}- :sub subtracts the previous index from the current one, and :set(.kwh) stores the consumption in each register.
- :mul prices the consumption, and :round(2) rounds each line to the cent, like the supplier's ledger.
- :aggSum adds up the registers, and :set(c.kwh) stores the result in the complement object
c.
The taxes and the total follow the same pattern, each one built from the previous values:
{c.kwh:mul(d.taxes.excise):round(2):set(c.excise)}
{d.taxes.ctaBase:mul(.ctaRate):round(2):set(c.cta)}
{c.supply:add(c.taxes):round(2):set(c.totalExclVat)}
{c.totalExclVat:mul(d.taxes.vat):round(2):set(c.vat)}
{c.totalExclVat:add(c.vat):round(2):set(c.amountDue)}
These tags print nothing. Then c.amountDue is available everywhere in the document, for example {c.amountDue:formatC} in the summary and on the slip, and in the barcode.
2. Format the amounts, quantities and dates
- Amounts use :formatC:
{c.amountDue:formatC}. Unit prices keep 4 or 5 decimals:{d.registers[i].unitPrice:formatC(4)}and{d.taxes.excise:formatC(5)}. - Quantities use :formatN:
{c.kwh:formatN(0)} kWh. - Dates use :formatD with an explicit pattern:
{d.invoice.dueDate:formatD('DD/MM/YYYY')}.
Tip: the result is generated with the options lang en-gb, and currencySource and currencyTarget EUR.
3. Repeat the address lines and the meter registers
- The address is an array of strings:
{d.customer.address[i]}on one line and{d.customer.address[i+1]}on the next. The same lines print in the envelope window and on the slip. - In the Meter readings table, the first row holds
{d.registers[i].name},{d.registers[i].prevIndex},{d.registers[i].currIndex}and{d.registers[i].kwh:formatN(0)} kWh, and the second row holds{d.registers[i+1].name}. Carbone prints one row for the peak hours and one for the off-peak hours. - The Charges table repeats the same registers between static rows:
Electricity, {d.registers[i].name}with{d.registers[i].amount:formatC}.
4. Show the payment instructions of the customer
The payment method changes the document. A customer who pays by cheque or bank transfer gets the payment instructions and the slip. A direct debit customer gets the debit date, the SEPA mandate reference and the creditor identifier, and no slip.
- The label of the total switches with :show and :elseShow:
{d.payment.method:ifEQ('direct_debit'):show('Amount debited on '):elseShow('Amount due by ')}- In the How to pay table, the Cheque row holds
{d.payment.method:ifEQ('direct_debit'):drop(row, 4)}, which removes the cheque, transfer, reference and card rows for a direct debit customer. - The Direct debit row holds
{d.payment.method:ifNE('direct_debit'):drop(row, 3)}, which removes the debit, mandate and creditor rows for the other customers. A direct debit customer also sendsdebitIbanandmandateReferenceinpayment.
:drop removes the rows from the document, so no empty line is left.
5. Fix the payment slip at the bottom of page 1
- The slip is a table positioned on the page: in Table Properties, set Text wrapping to Around, then in Positioning, set the horizontal position to 0 relative to the Page and the vertical position to 193 mm relative to the Page. The table spans the page width, so the dotted cut line runs from edge to edge.
- The slip stays at the same place whatever the length of the content above it, and it fills the bottom third of the folded sheet.
- The first row of the slip holds
{d.payment.method:ifEQ('direct_debit'):drop(table)}, which removes the slip for direct debit customers.
The barcode is a temporary picture with this tag in its alternative text:
{c.amountDue:mul(100):round(0):padl(8, '0'):prepend(d.invoice.number):prepend(d.customer.number):barcode(code128, height:13, includetext:false, scale:6)}- :mul and :round convert the amount into cents, and :padl pads it to 8 digits.
- :prepend adds the invoice number and the customer number in front of the amount.
- :barcode replaces the picture with a Code 128 barcode that the payment processing center scans. The line printed under the barcode repeats the same digits for manual entry.
6. Chart the consumption over 12 months
French invoices show the consumption history of the past year and tell actual readings from estimated ones. A native Word chart does both:
- Insert a Stacked Column chart, and fill its data sheet with one series per reading type:
| Actual reading | Estimated | |
|---|---|---|
{d.history[i].readingDate:formatD('MMM YY')} |
{d.history[i].type:ifEQ('actual'):show(.kwh):elseShow('')} |
{d.history[i].type:ifEQ('estimated'):show(.kwh):elseShow('')} |
{d.history[i+1].readingDate:formatD('MMM YY')} |
{d.history[i+1].type:ifEQ('actual'):show(.kwh):elseShow('')} |
{d.history[i+1].type:ifEQ('estimated'):show(.kwh):elseShow('')} |
- An empty cell draws no bar, so each month appears in one series only: actual readings in orange, estimated months in light orange.
- Above the chart,
{d.history[].kwh:aggSum:set(c.kwh12)}computes the 12-month total, printed with{c.kwh12:formatN(0)} kWh, next to the same period of the previous year:{d.sameMonthLastYear.kwh:formatN(0)} kWh.
7. Set a different header for the detail page
- Double-click the header, then check Different First Page in the Header & Footer tab. Page 1 keeps its header and footer empty, so the slip has the bottom of the page.
- The header of page 2 repeats the logo,
{d.invoice.number},{d.customer.number}and the page number, and the footer holds the supplier's legal identity.
Save the DOCX template, send your billing data, and Carbone generates one invoice per customer, with the right payment branch for each.
Related Examples
Trusted by 800+ paid customers in 40+ countries