Sales proposal deck
Quote lines, ROI and terms from your CPQ, in PowerPoint
- Template
- PPTX
- Export as
- PDF, PPTX, ODP, PNG, SVG +29 more
- Carbone
- 5.18+
Generate sales proposals from your CPQ or CRM
For every enterprise deal, the account executive sends a proposal: the client's priorities, the solution, the plan, the price, the business case and the terms to sign. The quote lines come from the CPQ (configure, price, quote) once the deal desk has approved the discounts, the opportunity and the contacts from the CRM, and the business case from a value calculator. Gartner counts proposal generators among the components of CPQ suites, yet many sales teams still rebuild the deck by hand for each revision of the quote.
Your CPQ sends the approved quote to the Carbone API as JSON and gets back the PowerPoint deck, in your brand, ready for a last read by the account executive. The template computes every price, total and ratio from the quote lines, so the deck always matches the quote. Add "convertTo": "pdf" to the request to send a PDF.
In this example, Ardentry, a fictional field service software vendor, proposes its platform to Meridale Facility Services, a fictional facility maintenance company with 420 technicians: quote Q-2026-04817, revision 2, valid until December 18, 2026, in US dollars. This example uses "lang": "en-us".
In this example, you will:
- Insert the prospect's logo from the JSON data
- Repeat the quote lines, the milestones, the next steps and the cards of the modules, phases and references
- Compute the net prices, the totals, the savings, the ROI and the payback with
:setand aggregators - Fill a native PowerPoint chart with values computed by the template
- Remove the optional items when the CPQ sends none
What the proposal contains
The nine slides follow the order of a strong B2B proposal: the client's needs first, then the answer, the price and the commitments. Shipley recommends addressing the customer's priorities, its "hot buttons", in the order the customer prefers, and the business case weighs benefits against costs like Forrester's Total Economic Impact method. Each slide carries one message in its title, and the figures tie out from slide to slide: the costs of the business case include the fees of the investment slide, and the billing schedule adds up to the total contract value.
| Slide | Content | What Carbone does |
|---|---|---|
| 1 Cover | Prospect's logo and contact, quote number, date, validity, account executive | Inserts the logo from the data, formats the dates |
| 2 Executive summary | The client's three priorities with today's metric, the recommendation, the key figures | One row per priority, a title computed from the payback and the net benefit |
| 3 Solution and scope | Five modules, what is in scope and out of scope | One card per module, one bullet per item |
| 4 Implementation plan | Five phases, key milestones with owner and acceptance criterion | One column per phase, the go-live milestones in color |
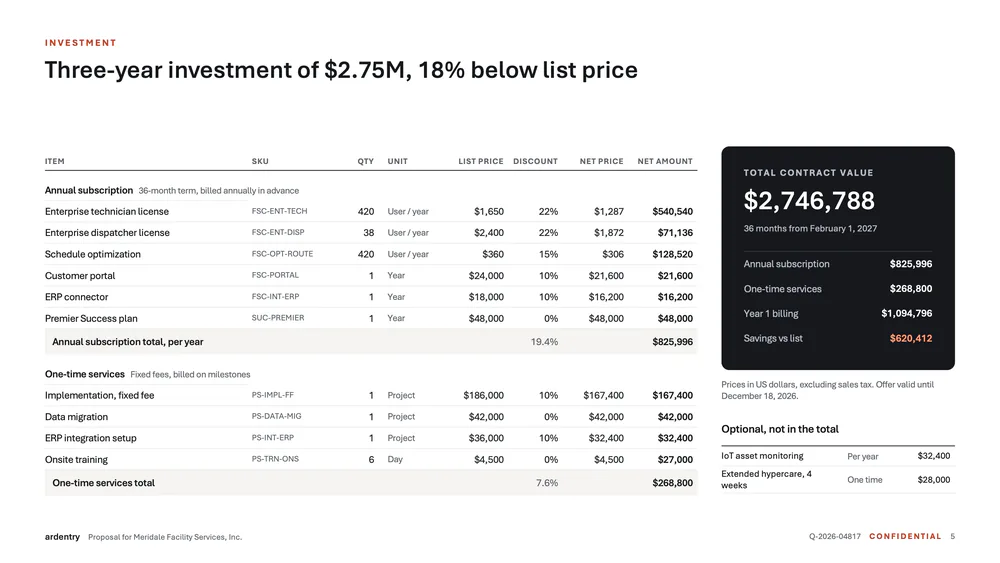
| 5 Investment | Quote lines with SKU, quantity, list price, discount and net price, subtotals, total contract value, savings, optional items | Computes every amount, removes the optional items when there are none |
| 6 Business case | Three-year benefits and costs, net benefit, payback, value drivers | Computes the ROI and the payback, fills the chart |
| 7 Customer references | Three customers with a result, a quote and a contact | One card per reference |
| 8 Terms and assumptions | Validity, term, billing, payment terms, taxes, renewal cap, agreement, billing schedule, assumptions | Computes the billing of each contract year |
| 9 Next steps and acceptance | Path to signature, signature blocks for both parties | One row per step |
How to automate a sales proposal deck in PowerPoint
1. Insert the prospect's logo
Insert a temporary picture on the cover and write the tag in its alt text (right-click > View Alt Text): {d.prospect.logo:imageFit(contain)}. The CRM sends the logo as a public URL or a Base64 data URI, and :imageFit(contain) keeps its proportions inside the frame of the temporary picture. Learn more about pictures in PPTX templates.
2. Repeat the quote lines
The investment table holds two loops, the subscriptions then the one-time services, each followed by its total row. The first row holds the [i] tags, like {d.subscriptions[i].name} and {d.subscriptions[i].listPrice:formatC(0)}, and the next row holds {d.subscriptions[i+1].name} to end the loop. The CPQ sends the raw lines only:
"subscriptions": [
  { "sku": "FSC-ENT-TECH", "name": "Enterprise technician license", "unit": "User / year", "qty": 420, "listPrice": 1650, "discount": 22 }
]
Learn more about loops in PPTX tables.
3. Compute every figure once with :set
The speaker notes of the investment slide hold the tags that compute the deck. They print nothing, and their results can be used on every slide:
{d.subscriptions[].discount:mul(-1):add(100):mul(.listPrice):div(100):set(.netPrice)}adds its net price to each line, and{d.subscriptions[].netPrice:mul(.qty):set(.netAmount)}its net amount. The table prints{d.subscriptions[i].netAmount:formatC(0)}.{d.subscriptions[].netAmount:aggSum:set(c.arr)}stores the annual subscription in the complement objectc, and{d.quote.termMonths:div(12):mul(c.arr):add(c.otc):set(c.tcv)}the total contract value.- Each contract year gets its billing, its benefits and its costs.
{d.years[].ramp:mul(c.runRate):div(100):set(.benefits)}applies the ramp-up of the year to the yearly value of the drivers. {d.years[0].costs:div(d.years[0].benefits):mul(12):set(c.payback)}computes the payback in months.
The titles read the stored values: {c.net:div(c.costs):mul(100):formatN(0)}% return over three years, with payback in {c.payback:formatN(0)} months. Learn more about :set and aggregators.
4. Fill the business case chart
Insert a clustered column chart (Insert > Chart), open its data sheet (right-click > Edit Data) and write {d.years[i].label}, {d.years[i].benefits} and {d.years[i].costs} on row 2, and the same tags with [i+1] on row 3. benefits and costs are not in the JSON: the :set tags of step 3 add them to each year, and the chart reads them like any other attribute. Learn more about charts in PPTX templates.
5. Place the cards and color the milestones
The modules, the phases of the plan and the references are cards: a rounded rectangle and text boxes, all at the position of the first card. Their alt text moves each copy to the right with :transform: {d.references[i].company:print(.i):mul(298.5):transform(x, pt)} places one card every 298.5 pt. The text box {d.references[i+1].company} ends the loop and sits in front of the card in the layer order.
In the milestones table, {d.milestones[i].key:ifEQ(true):show(B53F1E):elseShow(16181D):color(cell, text)} writes the go-live milestones in the accent color. Learn more about colors.
6. Remove the optional items
The optional items are not part of the total, and some quotes have none. {d.options:ifEM:drop(shape)} in the alt text of the heading and {d.options:ifEM:drop(table)} in the first cell of the table remove them when the array is empty. To give the optional items a slide of their own and remove it, use an ODP template with {d.options:ifEM:drop(slide)} and convert the report to PPTX: see Slides. Learn more about smart conditions.
Related Examples
Trusted by 800+ paid customers in 40+ countries